- Ethereum price started an upside correction from the $313 swing low against the US Dollar.
- ETH price is currently struggling to clear the $365 resistance and trading just above the 55 simple moving average (4-hours).
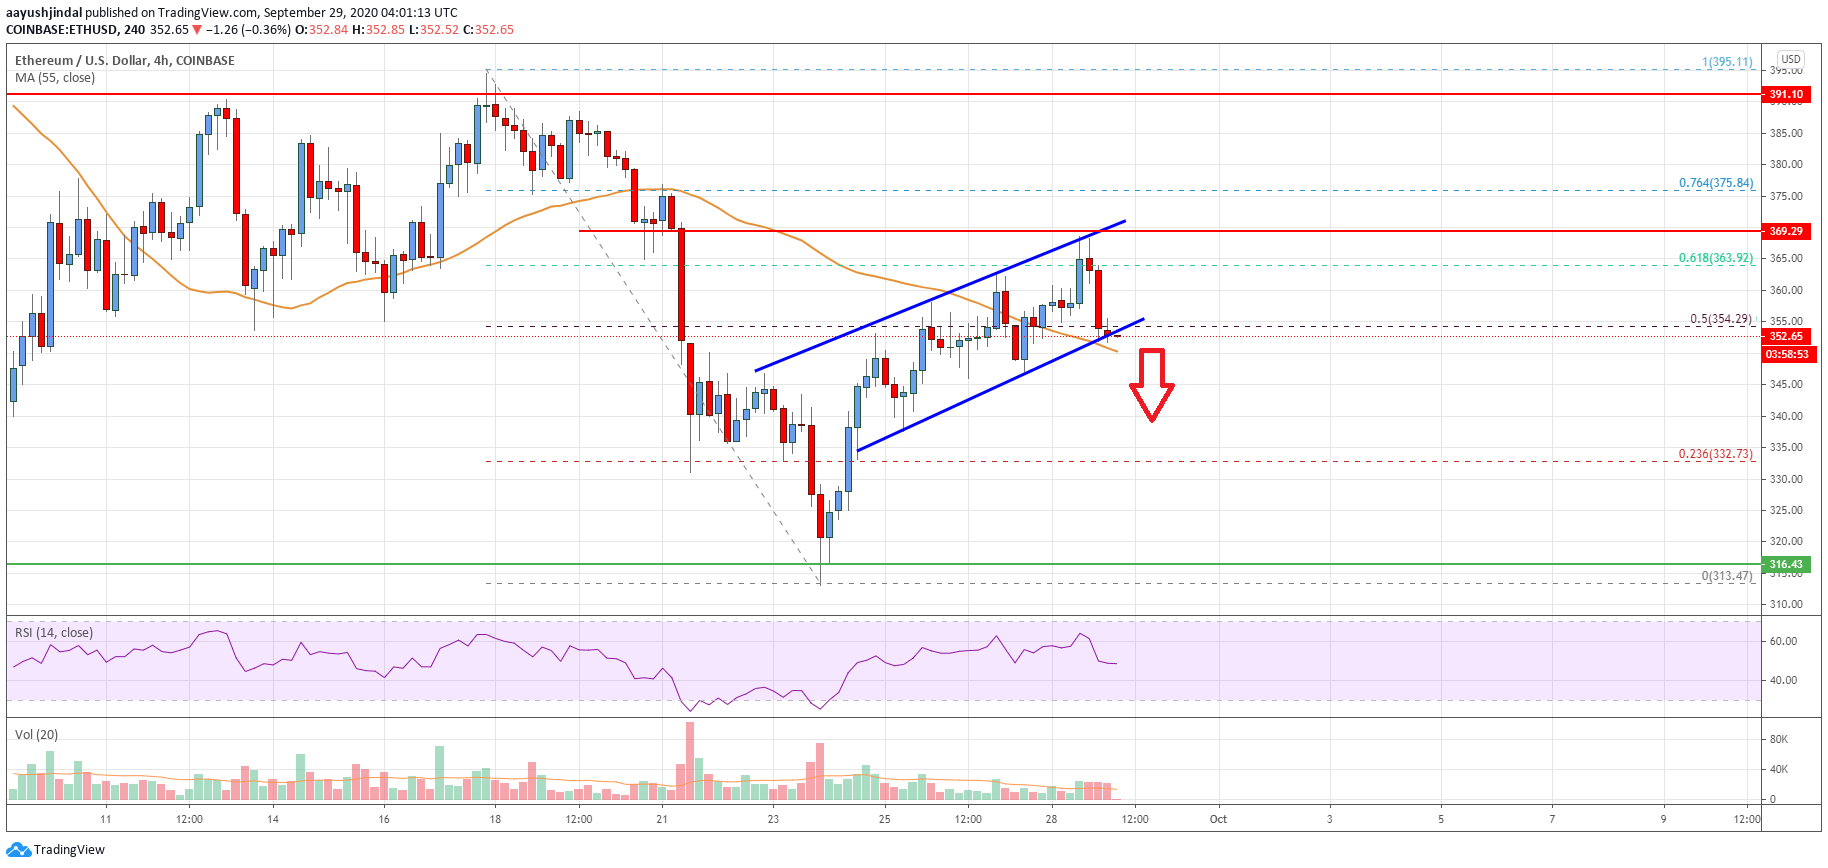
- There was a break below a key ascending channel with support near $354 on the 4-hours chart (data feed from Coinbase).
- The pair could accelerate further if it breaks the $350 support level in the near term.
Ethereum price is declining and trading below the $355 support against the US Dollar. It seems like ETH/USD is likely to nosedive below $350 and $345.
Ethereum Price Analysis
After forming a support base above $315, Ethereum price started a decent correction above $320 against the US Dollar. ETH price broke a couple of key resistance near the $335 level to move into a positive zone.
The price traded above the 50% Fib retracement level of the main decline from the $395 high to $313 swing low. Finally, the price spiked above the $360 level, but it failed to continue higher above the $370 level.
It seems like the bulls struggled to remain in action above the $365 resistance zone. The price also failed near the 61.8% Fib retracement level of the main decline from the $395 high to $313 swing low. It is currently struggling to clear the $365 resistance and trading just above the 55 simple moving average (4-hours).
There was a break below a key ascending channel with support near $354 on the 4-hours chart. The price is clearing showing bearish signs below $360 and $355. If there is a downside break below the $350 support and the 55 simple moving average (4-hours), there are chances of a sharp decline.
The next major support is near the $345 level, below which the bears are likely to aim a larger decline towards the $330 and $320 levels in the coming sessions.
On the upside, the previous key support near the $365 zone is likely to act as a major resistance. The next major resistance is near the $370 level, above which the bulls are likely to take control.
Looking at the chart, Ethereum price is clearly struggling to stay above the $350 support level and the 55 simple moving average (4-hours). Overall, the price could accelerate further if it breaks the $350 support level in the near term.
Technical indicators
4 hours MACD – The MACD for ETH/USD is now gaining momentum in the bearish zone.
4 hours RSI (Relative Strength Index) – The RSI for ETH/USD is just below the 50 level.
Key Support Levels – $350, followed by the $345 zone.
Key Resistance Levels – $365 and $370.