- Ethereum price traded to a new 2020 high at $231 and recently corrected lower against the US Dollar.
- ETH price is currently trading below the $225 and $224 support levels.
- There is a key bullish trend line forming with support near $206 on the 4-hours chart (data feed from Coinbase).
- The price is likely to bounce back after it completes the current correction near $213 or $206.
Ethereum price is trading nicely in an uptrend above $200 against the US Dollar. ETH/USD is currently correcting lower, but dips remain supported above $206.
Ethereum Price Analysis
In the past few days, there was a strong rise in Ethereum price above the $200 and $205 resistance levels against the US Dollar. Moreover, ETH price settled above the $200 level and the 55 simple moving average (4-hours).
Finally, the price surpassed the $220 resistance area and traded to a new 2020 high at $231. Recently, there was a downside correction below the $225 support area. The price even declined below the 23.6% Fib retracement level of the upward move from the $184 low to $231 high.
On the downside, an initial support is near the $214 level. It was the last breakout zone and it could now provide support near $214-$215. The next major support is near the $207 level and 55 simple moving average (4-hours).
Moreover, there is a key bullish trend line forming with support near $206 on the 4-hours chart. The trend line also coincides with the 50% Fib retracement level of the upward move from the $184 low to $231 high.
Therefore, the price is likely to find a strong buying interest near the $207 and $206 levels. It the bulls fails to keep the price above the $206 level and the 55 SMA, there is a risk of a larger decline towards $200.
On the upside, there is a key resistance forming near the $225 and $230 levels. A successful follow through above the $230 level and the $231 high is needed for another increase. The next target for the bulls could be near the $250 level.
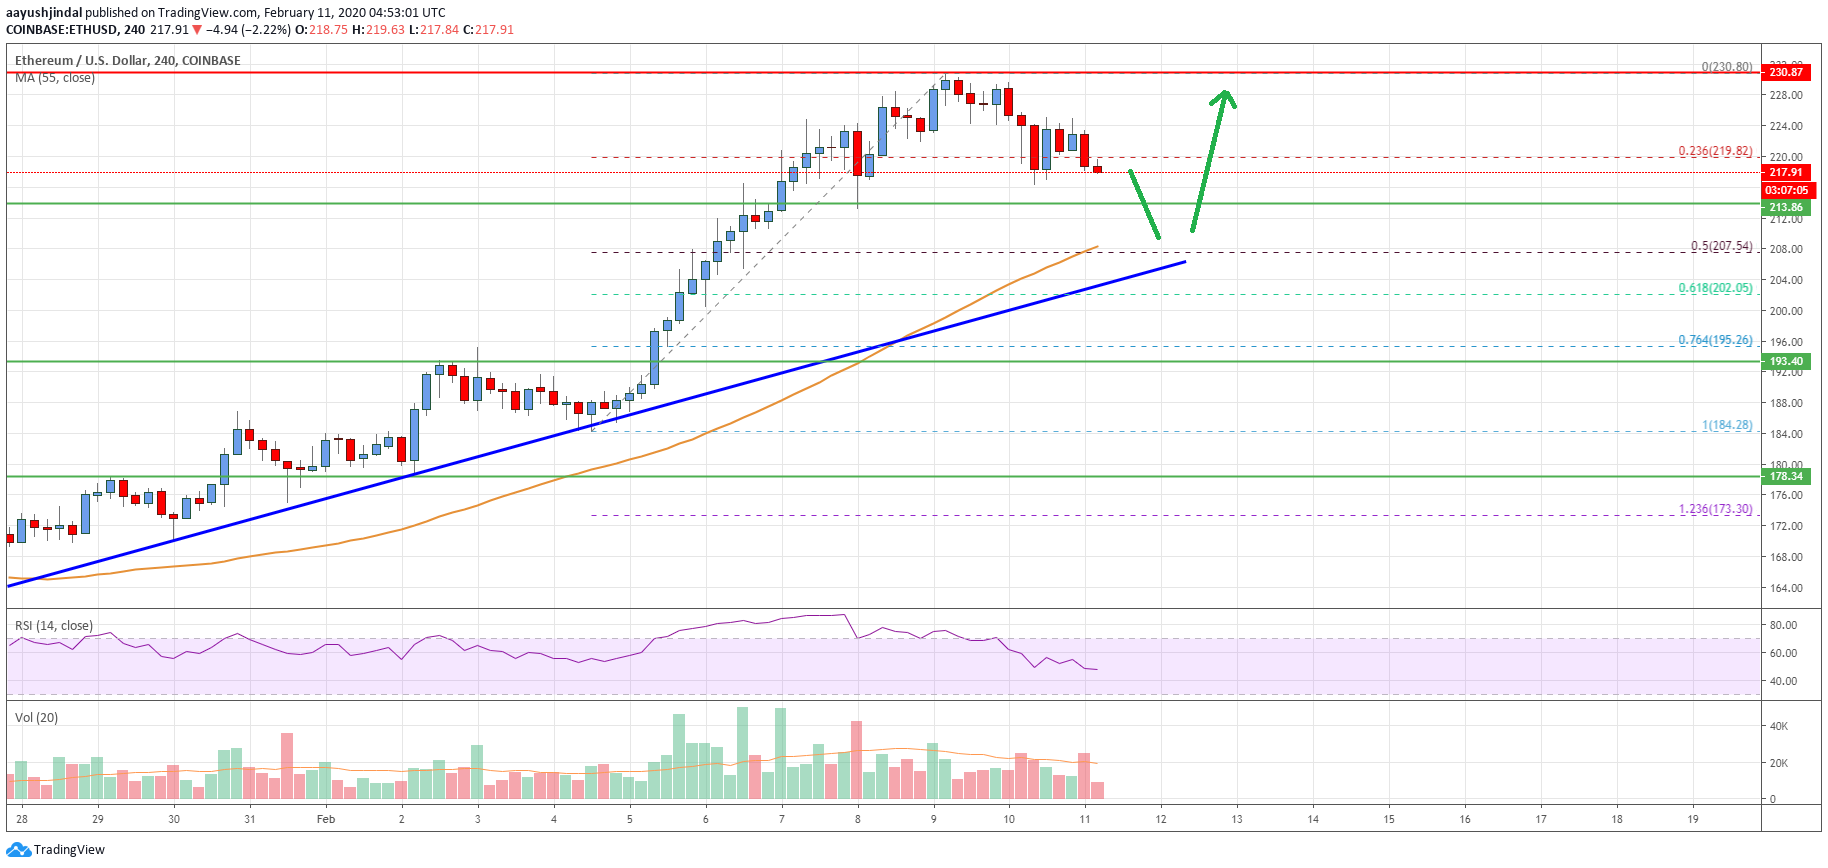
Looking at the chart, Ethereum price is clearly correcting gains from the $231 swing high. In the short term, there could be a downside correction below $215, but the price is likely to find support near $206.
Technical indicators
4 hours MACD – The MACD for ETH/USD is currently losing momentum in the bullish zone.
4 hours RSI (Relative Strength Index) – The RSI for ETH/USD is now just below the 50 level.
Key Support Levels – $206, followed by the $200 zone.
Key Resistance Levels – $225 and $230.