- Ethereum price climbed higher nicely and traded to a new 2020 high at $195 against the US Dollar.
- ETH price is currently correcting lower and it broke the $190 support level.
- There is a major bullish trend line forming with support near $185 on the 4-hours chart (data feed from Coinbase).
- The price is likely to bounce back after testing the $185 support area and the trend line.
Ethereum price is trading in a nice uptrend above $185 and $178 against the US Dollar. ETH/USD is likely to resume its uptrend after it completes its correction near $185 or $178.
Ethereum Price Analysis
In the past few days, there was a steady rise in Ethereum price above the $175 and $178 resistance levels against the US Dollar. Moreover, ETH price settled above the $180 level and the 55 simple moving average (4-hours).
Finally, the price surpassed the $190 level and traded to a new 2020 high at $195. Recently, there was a downside correction below the $192 level. The price declined below the 23.6% Fib retracement level of the recent rise from the $178 swing low to $195 high.
It is now trading near the $187 support. It coincides with the 50% Fib retracement level of the recent rise from the $178 swing low to $195 high. Moreover, there is a major bullish trend line forming with support near $185 on the 4-hours chart.
A downside break below the trend line support and $185 might start a downside extension in the near term. The next major support is near the last swing low at $178 and the 55 simple moving average (4-hours).
Any further losses may perhaps lead the price towards the $174 level. It is the 1.236 Fib extension level of the recent rise from the $178 swing low to $195 high.
On the upside, there is a major resistance forming near the $193 and $195 levels. A successful break above the $195 level could initiate a larger rally above the $200 and $205 levels in the near term.
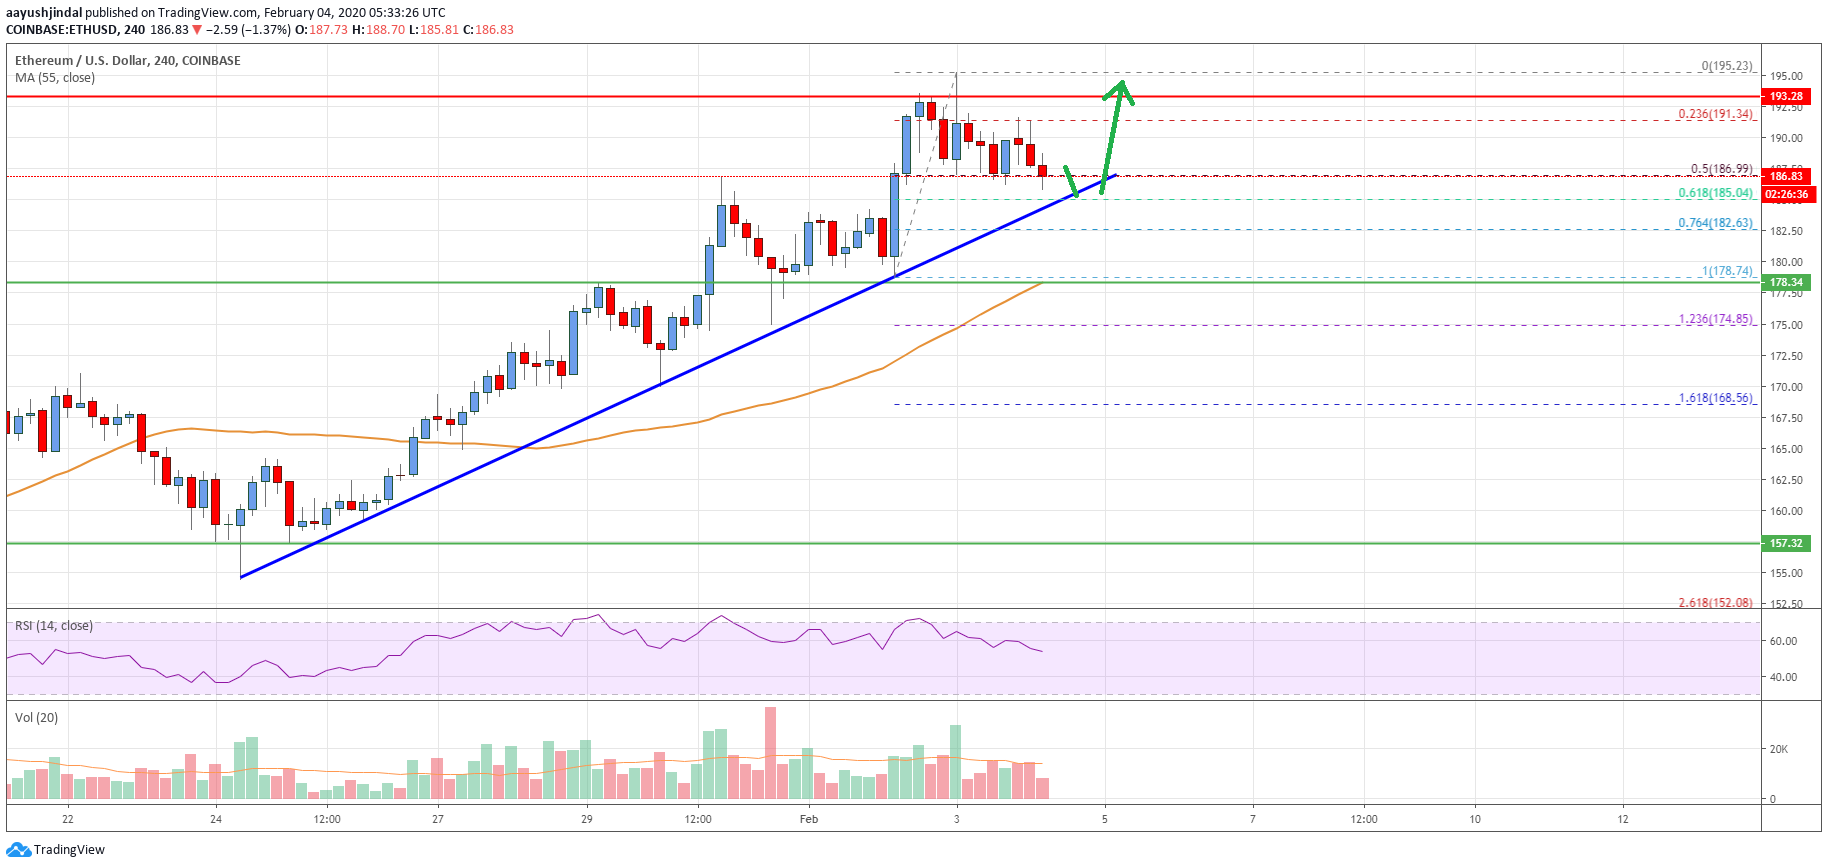
Looking at the chart, Ethereum price is clearly trading in a nice uptrend above a major bullish trend line and $178. Therefore, there are high chances of a strong upward move unless there is a close below $178.
Technical indicators
4 hours MACD – The MACD for ETH/USD is currently losing momentum in the bullish zone.
4 hours RSI (Relative Strength Index) – The RSI for ETH/USD is slowly declining and approaching the 50 level.
Key Support Levels – $185, followed by the $178 zone.
Key Resistance Levels – $195 and $200.