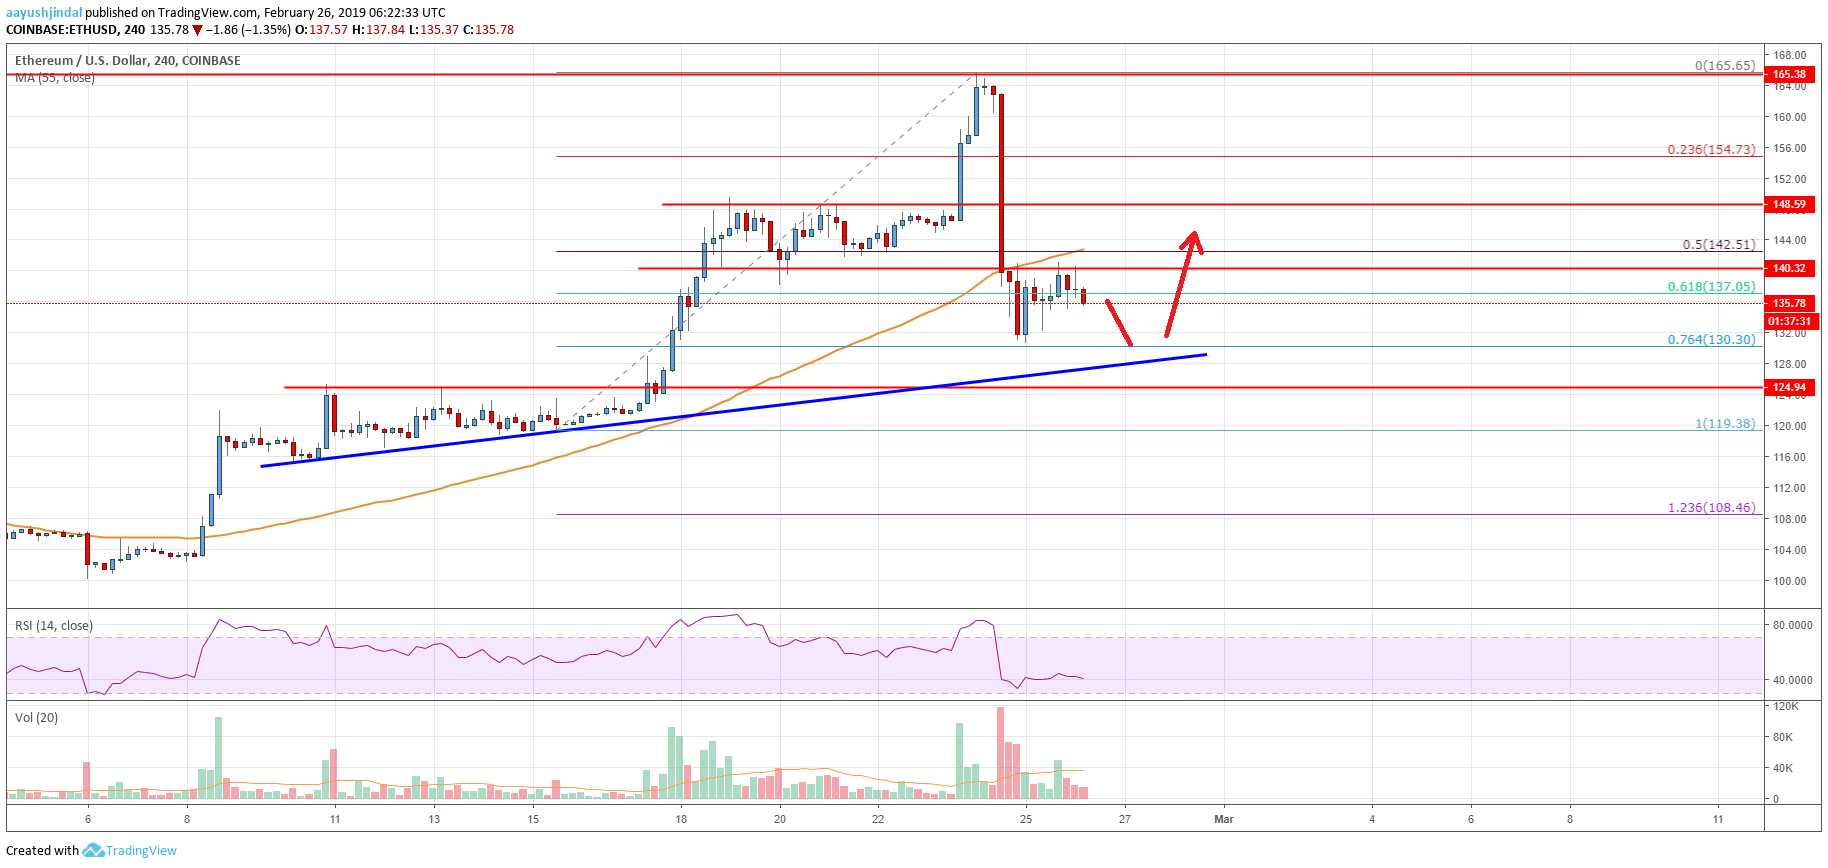
- Ethereum price topped near the $165 level recently and later declined sharply against the US Dollar.
- ETH traded below the $148 and $140 support levels to move into a short term bearish zone.
- There is a major bullish trend line formed with support at $130 on the 4-hours chart (data feed from Coinbase).
- The price is likely to find a strong buying interest if it declines towards the $130 support area.
Ethereum price nosedived from the $165 swing high against the US Dollar. ETH broke the $140 support level, but it could find a strong buying interest near the $130 support area.
Ethereum Price Analysis
This past week, there was a sharp upward move above the $140 resistance in Ethereum price against the US Dollar. The ETH/USD pair even broke the $148 resistance and traded above the $160 level. It traded towards the $165-166 resistance zone, where sellers took a stand. The price topped near the $165 level and later declined sharply. It broke many supports such as $152, $148, $142, $140 and $137. Besides, the price broke the 50% Fib retracement level of the last rise from the $119 low to $165 high.
There was even a close below the $148 level and the 55 simple moving average (4-hours). It opened the doors for more losses and the price traded towards the $130 support. It traded close to the 76.4% Fib retracement level of the last rise from the $119 low to $165 high. Later, the price recovered above the $137 and $138 levels. However, the recovery was capped by the $140 resistance and the 55 simple moving average (4-hours).
Therefore, there are chances of a minor dip in ETH price below the $135 level in the short term. On the downside, there is a strong support formed near the $129-130 zone. There is also a major bullish trend line formed with support at $130 on the 4-hours chart. Should ETH decline below the $130 support, the price could accelerate losses towards the $125 support area.

Looking at the chart, Ethereum price is trading nicely above key supports near $130. The recent decline was discouraging, but as long as the price is above $125 and $130, there are chances of a fresh bullish wave. On the upside, the price must break the $144 and $146 levels to enter a positive zone.
Technical indicators
4 hours MACD – The MACD for ETH/USD is currently placed in the bearish zone, with a few positive signs.
4 hours RSI (Relative Strength Index) – The RSI for ETH/USD settled below the 50 level, with a bearish structure.
Key Support Levels – $130, followed by the $125 zone.
Key Resistance Levels – $144 and $146.


