- EOS price retested the $2.400 support area and it is currently correcting higher against the US Dollar.
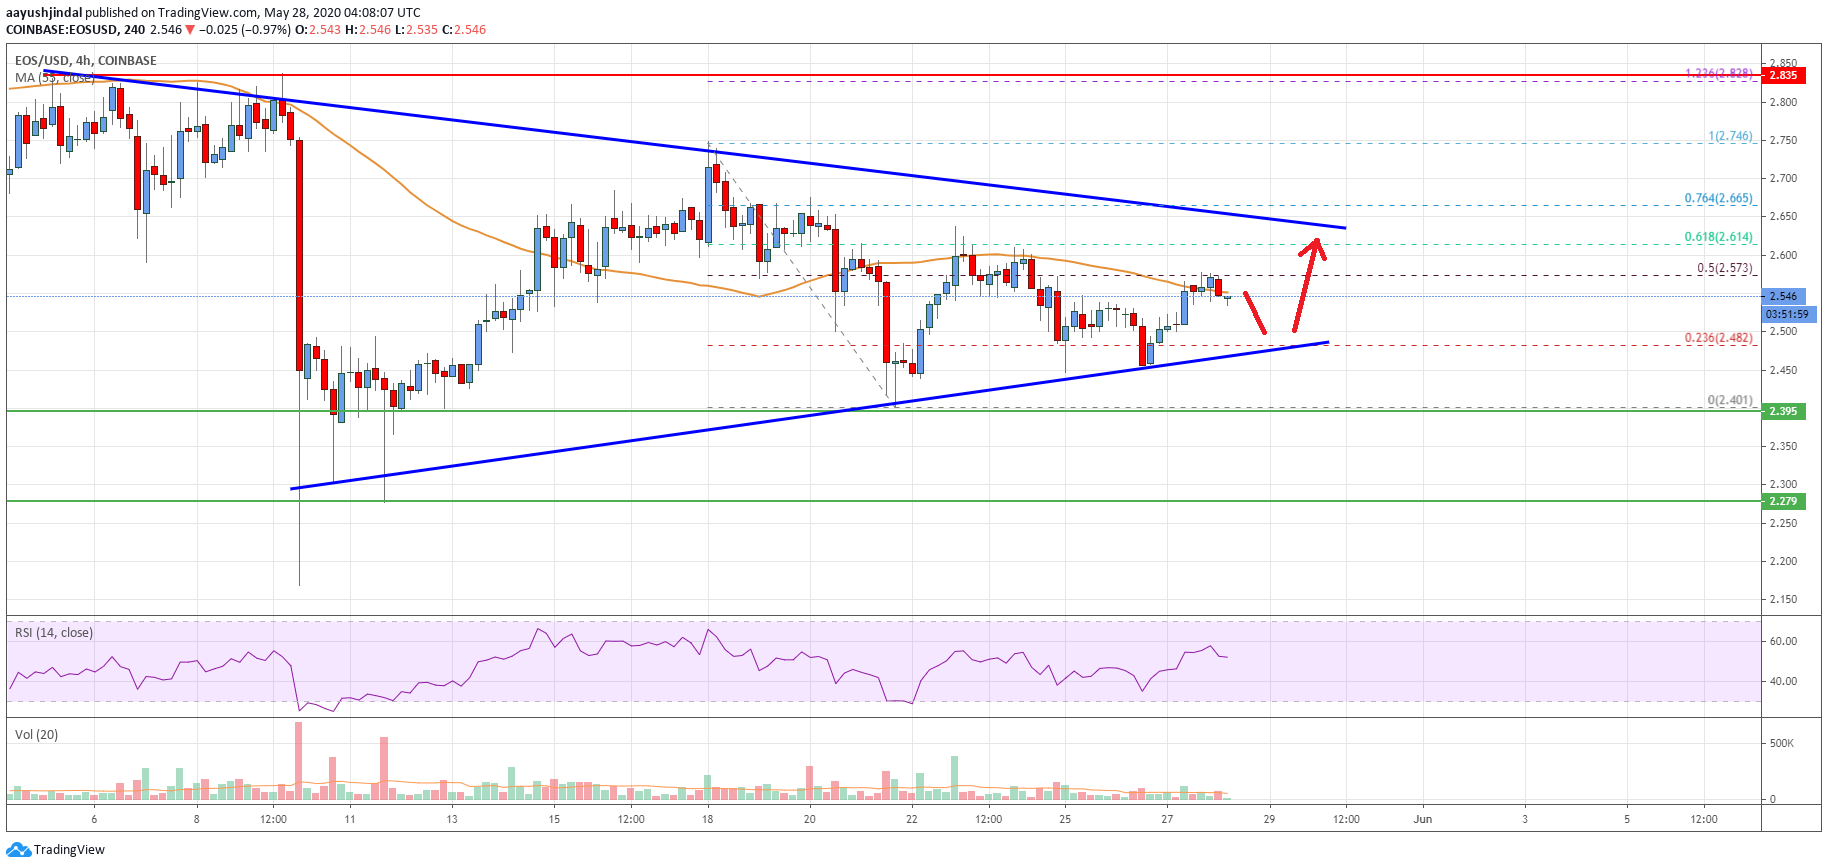
- The price is currently trading near the $2.550 resistance and the 55 simple moving average (4-hours).
- There is a key contracting triangle forming with resistance near $2.650 on the 4-hours chart of the EOS/USD pair (data feed from Coinbase).
- The pair could start a strong increase if it clears the $2.650 resistance zone in the near term.
EOS price is slowly recovering higher against the US Dollar, similar to bitcoin. However, the price must gain pace above the $2.650 barrier to continue higher in the near term.
EOS Price Analysis
This past week, EOS price failed to stay above the $2.650 level and declined below $2.550 against the US Dollar. The price broke the $2.500 support zone and tested the $2.400 level.
A low is formed near $2.401 and the price recently started an upside correction. There was a break above the $2.500 resistance zone. The price climbed above the 50% Fib retracement level of the recent decline from the $2.746 high to $2.401 low.
At the moment, the price seems to be facing hurdles near the $2.550 level and the 55 simple moving average (4-hours). It seems like the 61.8% Fib retracement level of the recent decline from the $2.746 high to $2.401 low is facing hurdles.
There is also a key contracting triangle forming with resistance near $2.650 on the 4-hours chart of the EOS/USD pair. If there is an upside break above the $2.650 resistance, there are chances of more upsides in the near term.
The next major hurdle is near the $2.800 level, above which the price could rally towards the $3.000 level. Conversely, the price might fail to continue above the $2.650 resistance zone.
On the downside, the first major support is seen near the $2.500 level and the triangle lower trend line. If there is a bearish break below the triangle support, the price could revisit the $2.400 support zone. Any further losses may perhaps lead the price towards the $2.225 level.
Looking at the chart, EOS price is clearly preparing for the next major break and it might rally if it clears the $2.650 resistance. If not, there is a risk of a fresh decline towards the $2.400 and $2.225 levels.
Technical indicators
4-hours MACD – The MACD for EOS/USD is losing momentum in the bullish zone.
4-hours RSI (Relative Strength Index) – The RSI is just above the 50 level.
Major Support Levels – $2.500 and $2.400.
Major Resistance Levels – $2.650 and $2.800.