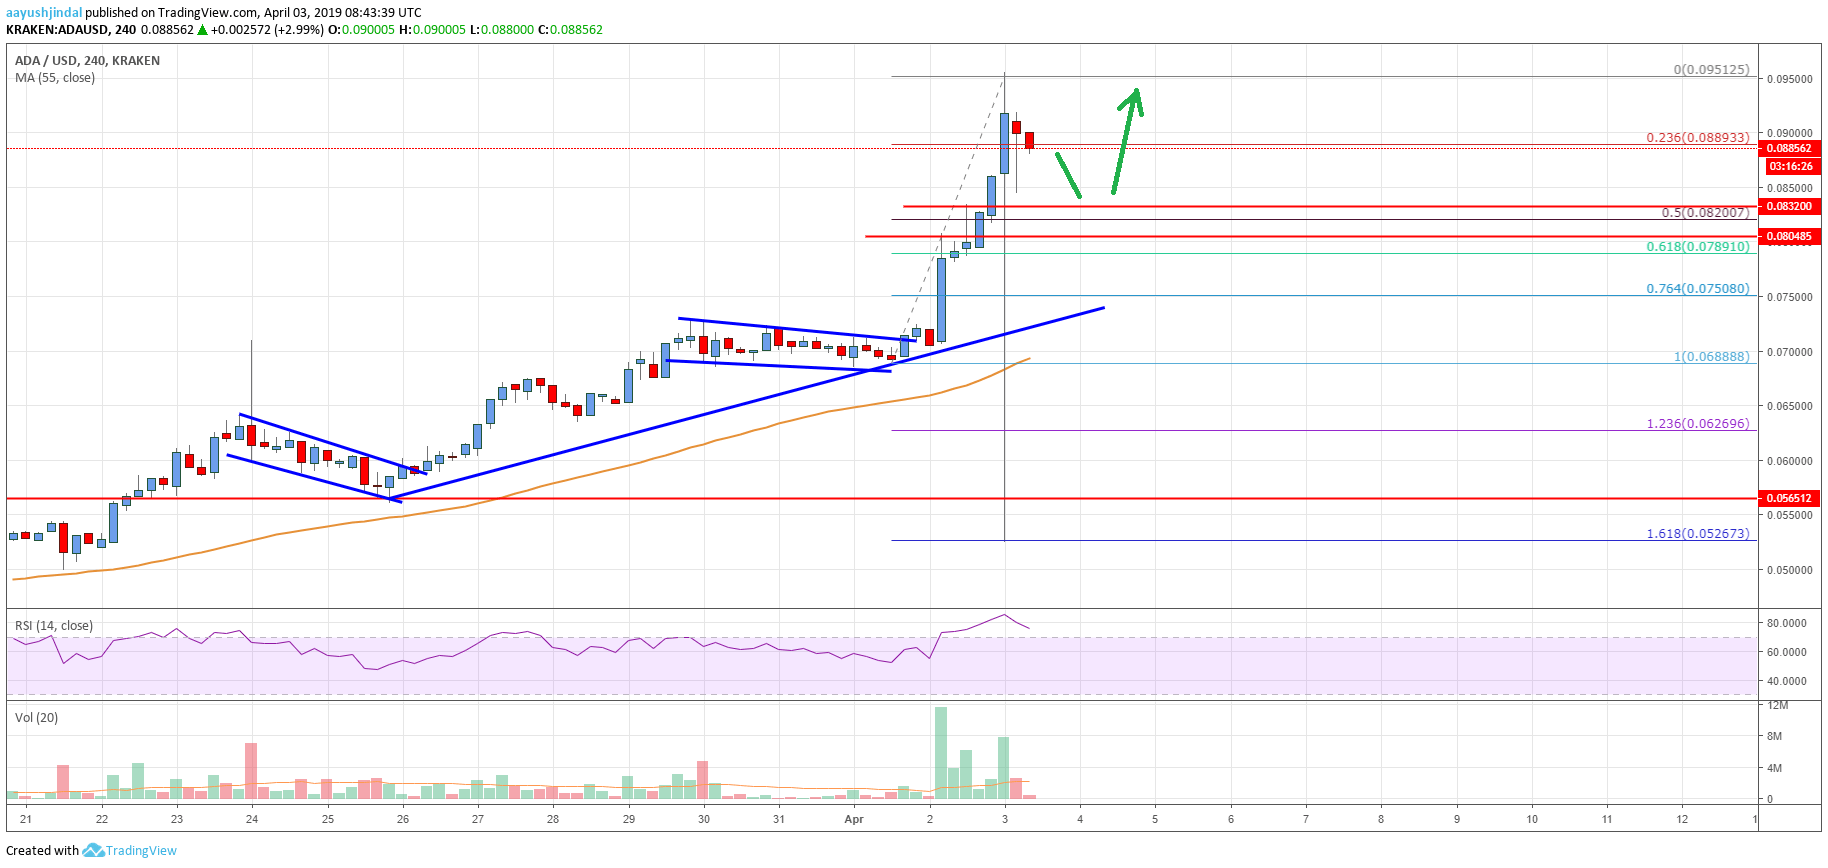
- ADA price surged more than 20% after forming a support base near $0.0565 against the US Dollar.
- The price traded above the key $0.0700 and $0.0800 resistance levels in the past three sessions.
- There was a break above a couple of declining channels or bullish flags at $0.0620 and $0.0710 on the 4-hours chart (data feed via Kraken).
- The price pumped above the $0.0900 level and tested the $0.0950 resistance level.
Cardano price gained a strong bullish momentum recently against the US Dollar and bitcoin. ADA surged above the $0.0900 level and it may continue to rise towards the $0.1000 level.
Cardano Price Analysis
Recently, there was a strong rise in the cryptocurrency market as bitcoin price climbed above the $5,000 level. It helped cardano price in gaining bullish momentum above the $0.0700 resistance against the US Dollar. Earlier, the ADA/USD pair formed a solid support base near the $0.0565 level and started an upside move. It settled above the $0.0600 level and the 55 simple moving average (4-hours) to move into a positive zone.
Besides, there was a break above a couple of declining channels or bullish flags at $0.0620 and $0.0710 on the 4-hours chart. The pair rallied significantly above the $0.0800 and $0.0880 resistance levels. Finally, the price broke the $0.0900 resistance and traded to a new 2019 high at $0.0951. At the moment, the price is correcting lower below the $0.0900 level. It broke the 23.6% Fibonacci retracement level of the recent wave from the $0.0688 low to $0.0951 high.
However, there are many supports on the downside near the $0.0840 and $0.0830 levels. The 50% Fibonacci retracement level of the recent wave from the $0.0688 low to $0.0951 high is also near the $0.0820 level. The main support is at $0.0800, where buyers are likely to emerge. On the upside, an initial resistance is near the $0.0920 level. If there are further gains, the price is likely to clear the $0.0951 high.

The chart indicates that ADA price is placed nicely in a crucial uptrend above $0.0800. If buyers remain in action, there are chances of an upside break above the $0.0951 high. The next stop for buyers could be near the $0.1000 pivot level, where sellers may emerge. Above $0.1000, the price may test the $0.1040 and $0.1080 levels. On the downside, there are many supports above the $0.0800 level and dips remain well bid.
Technical Indicators
4 hours MACD – The MACD for ADA/USD is slowly reducing the recent bullish slope.
4 hours RSI – The RSI for ADA/USD is currently correcting lower from the 90 level, with a minor bearish angle.
Key Support Levels – $0.0840 and $0.0820.
Key Resistance Levels – $0.0950 and $0.1000.


