- ADA price declined steadily after it failed to surpass the $0.0400 resistance against the US Dollar.
- The price is slowly approaching the key $0.0355 support area.
- Earlier, there was a break below a key contracting triangle with support near $0.0382 on the 4-hours chart (data feed via Kraken).
- The price is under pressure and it seems like it could even struggle to hold the $0.0355 support.
Cardano price is showing a lot of bearish signs against the US Dollar and bitcoin. ADA price is likely to continue lower below $0.0355 and $0.0340 in the near term.
Cardano Price Analysis
This past week, cardano price made an attempt to surpass the $0.0400 resistance area against the US Dollar. However, the ADA/USD pair failed to gain strength above $0.0390 and topped near the $0.0392 level.
As a result, the pair started a fresh decrease below the $0.0380 level and the 55 simple moving average (4-hours). Moreover, there was a break below a key contracting triangle with support near $0.0382 on the 4-hours chart.
It opened the doors for more downsides towards the $0.0355 support. The recent low is $0.0361 and the price is currently consolidating losses. An immediate resistance is near the $0.0368 level.
Besides, the 23.6% Fibonacci retracement level of the recent decline from the $0.0392 high to $0.0361 low is also near $0.0368. The first major resistance is near the $0.0375 area and the 55 simple moving average (4-hours).
The 50% Fibonacci retracement level of the recent decline from the $0.0392 high to $0.0361 low is also near the $0.0376 level to act as a strong resistance.
The main resistance on the upside is still near the $0.0392 and $0.0400 levels. A clear break above $0.0400 is needed for cardano bulls to return into action. The next resistance is seen near the $0.0420 level.
On the downside, an initial support is near the $0.0360 level. The first major support is near the $0.0355 level, below which the bears are likely to aim the last month swing low near the $0.0330 level. Any further losses might lead the price towards the $0.0300 level.
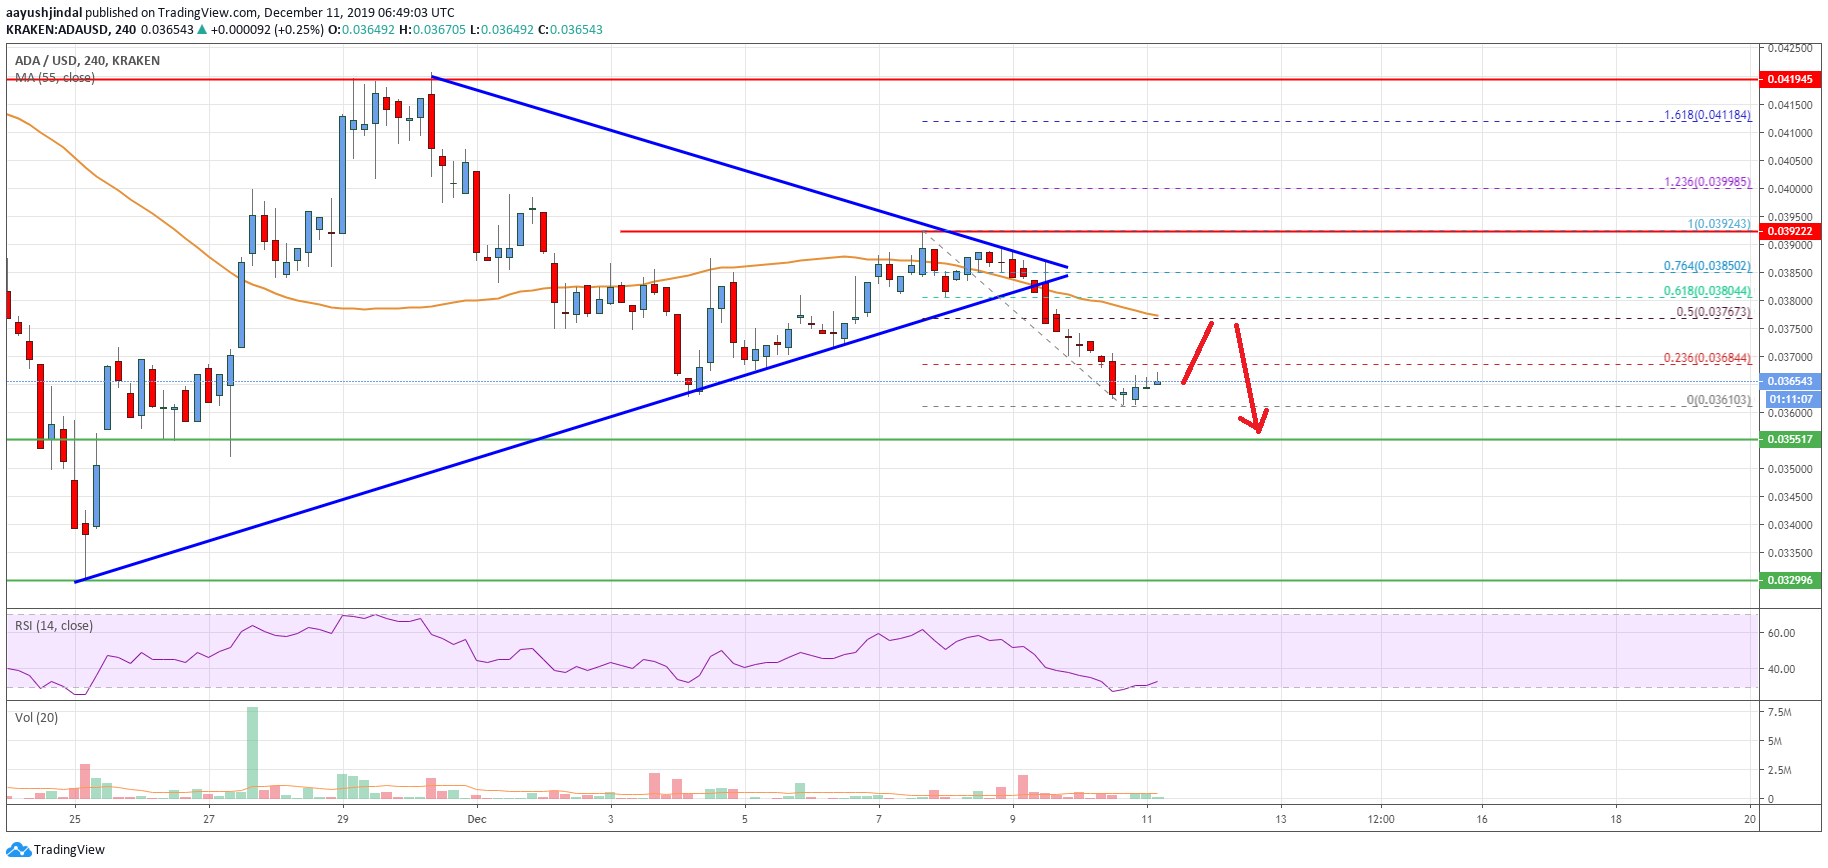
The chart indicates that ADA price is clearly back in a bearish zone below $0.0380 and $0.0400. As long as the price is below $0.0400, the bears remain in control and they seem to be eyeing a test of the $0.0330 level.
Technical Indicators
4 hours MACD – The MACD for ADA/USD is slowly reducing its bearish slope.
4 hours RSI – The RSI for ADA/USD is currently correcting higher towards the 40 level.
Key Support Levels – $0.0355 and $0.0330.
Key Resistance Levels – $0.0382 and $0.0400.