- ADA price is gaining pace above the $0.4200 zone against the US Dollar.
- The price is now trading above $0.400 and the 55 simple moving average (4 hours).
- There is a key bearish trend line forming with resistance near $0.4410 on the 4-hours chart (data feed via Coinbase).
- The price could start a fresh increase if it clears the $0.441 and $0.450 resistance levels.
Cardano’s price is rising above $0.400 against the US Dollar, similar to Bitcoin. ADA price could resume its rally if there is a clear move above the $0.450 resistance.
Cardano Price Analysis
This week, Cardano’s price started a steady increase above the $0.40 resistance zone against the US Dollar. The ADA/USD pair gained pace for a move above the $0.420 and $0.432 levels.
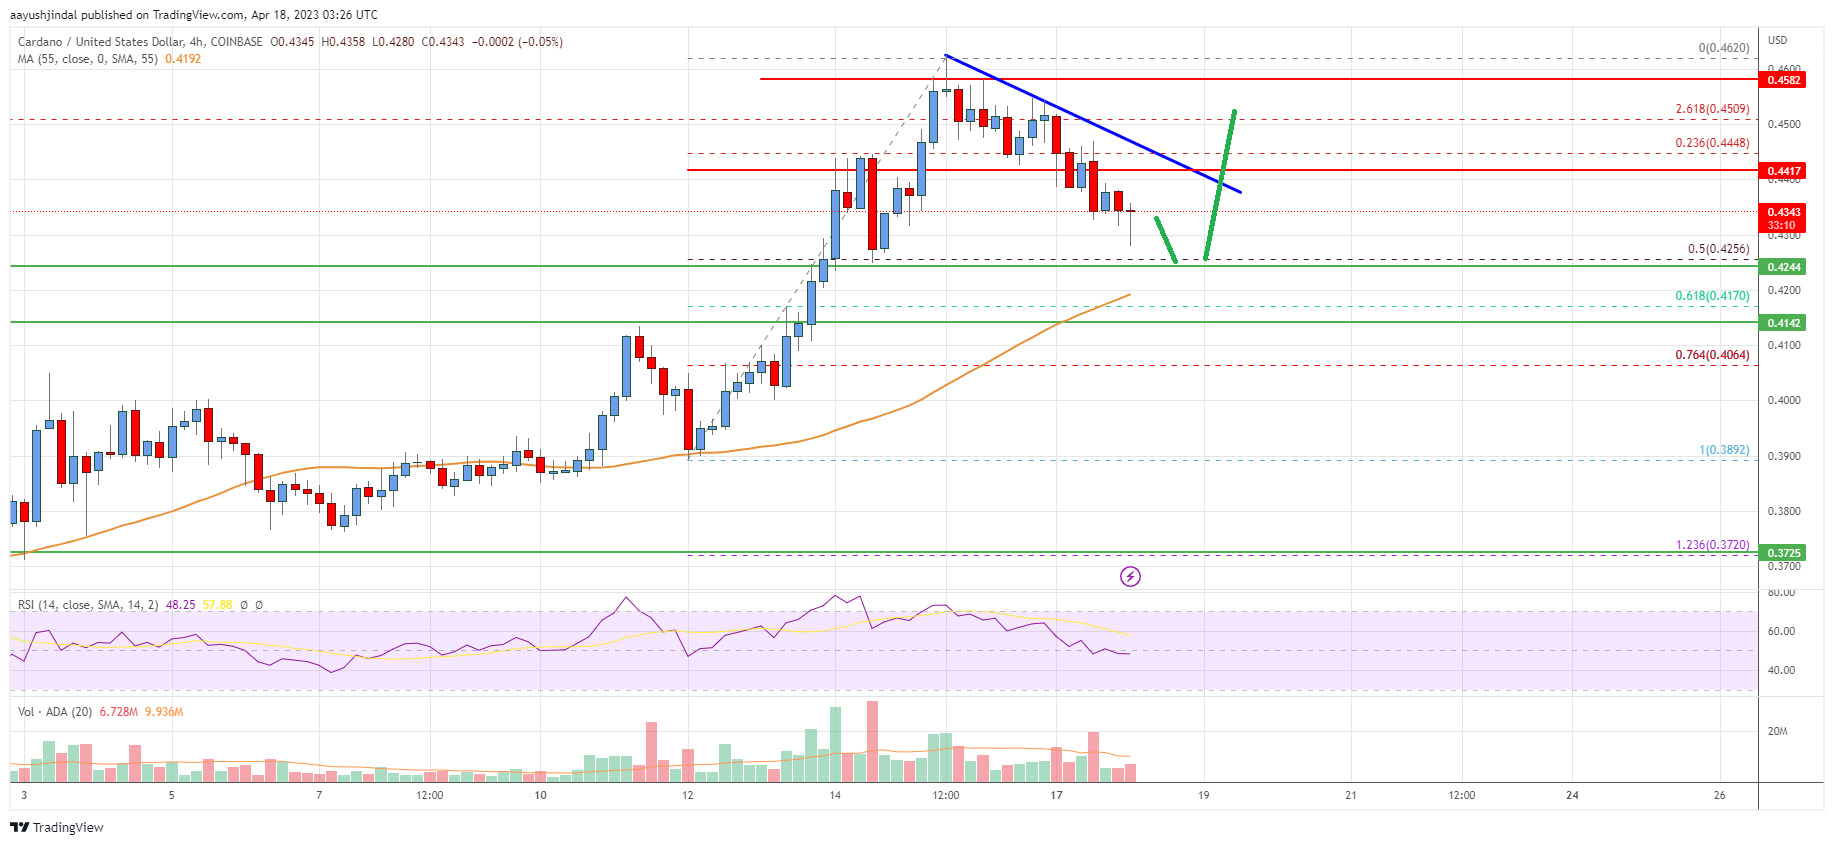
The price tested the $0.460 zone. A high is formed near $0.4620 and the price is now correcting lower. There was a move below the $0.450 support zone. The price dipped below the 23.6% Fib retracement level of the upward move from the $0.3892 swing low to the $.4620 high.
However, ADA price is now trading above $0.40 and the 55 simple moving average (4 hours). On the upside, immediate resistance is near the $0.440 zone.
There is also a key bearish trend line forming with resistance near $0.4410 on the 4-hours chart. The next major resistance is near the $0.4500 zone. A clear move above the $0.4500 resistance might start a strong increase toward $0.480.
Any more gains above the $0.480 resistance might send the price toward the $0.500 resistance or even $0.520. On the downside, immediate support is near the $0.425 level.
The next major support is near the $0.4170 level or the 61.8% Fib retracement level of the upward move from the $0.3892 swing low to the $.4620 high. A clear move below the $0.417 level might send the price toward the $0.400 level. Any more losses might send the price toward the $0.380 support.

The chart indicates that ADA price is now trading above $0.420 and the 55 simple moving average (4 hours). Overall, the price could gain bullish momentum if it clears the $0.441 and $0.450 resistance levels.
ADA Technical Indicators
4 hours MACD – The MACD for ADA/USD is now losing pace in the bullish zone.
4 hours RSI – The RSI for ADA/USD is now above the 50 level.
Key Support Levels – $0.425 and $0.417.
Key Resistance Levels – $0.441 and $0.450.


