- ADA price is gaining bullish momentum above the $0.0425 resistance area against the US Dollar.
- The price is likely to break the $0.0450 and $0.0465 resistance levels in the near term.
- There is a key bullish trend line forming with support near $0.0425 on the 4-hours chart (data feed via Kraken).
- The price is following a decent bullish path above the $0.0425 and $0.0420 support levels.
Cardano price is showing bullish continuation signs against the US Dollar and bitcoin. ADA price is likely to climb above $0.0450 to continue towards $0.0500.
Cardano Price Analysis
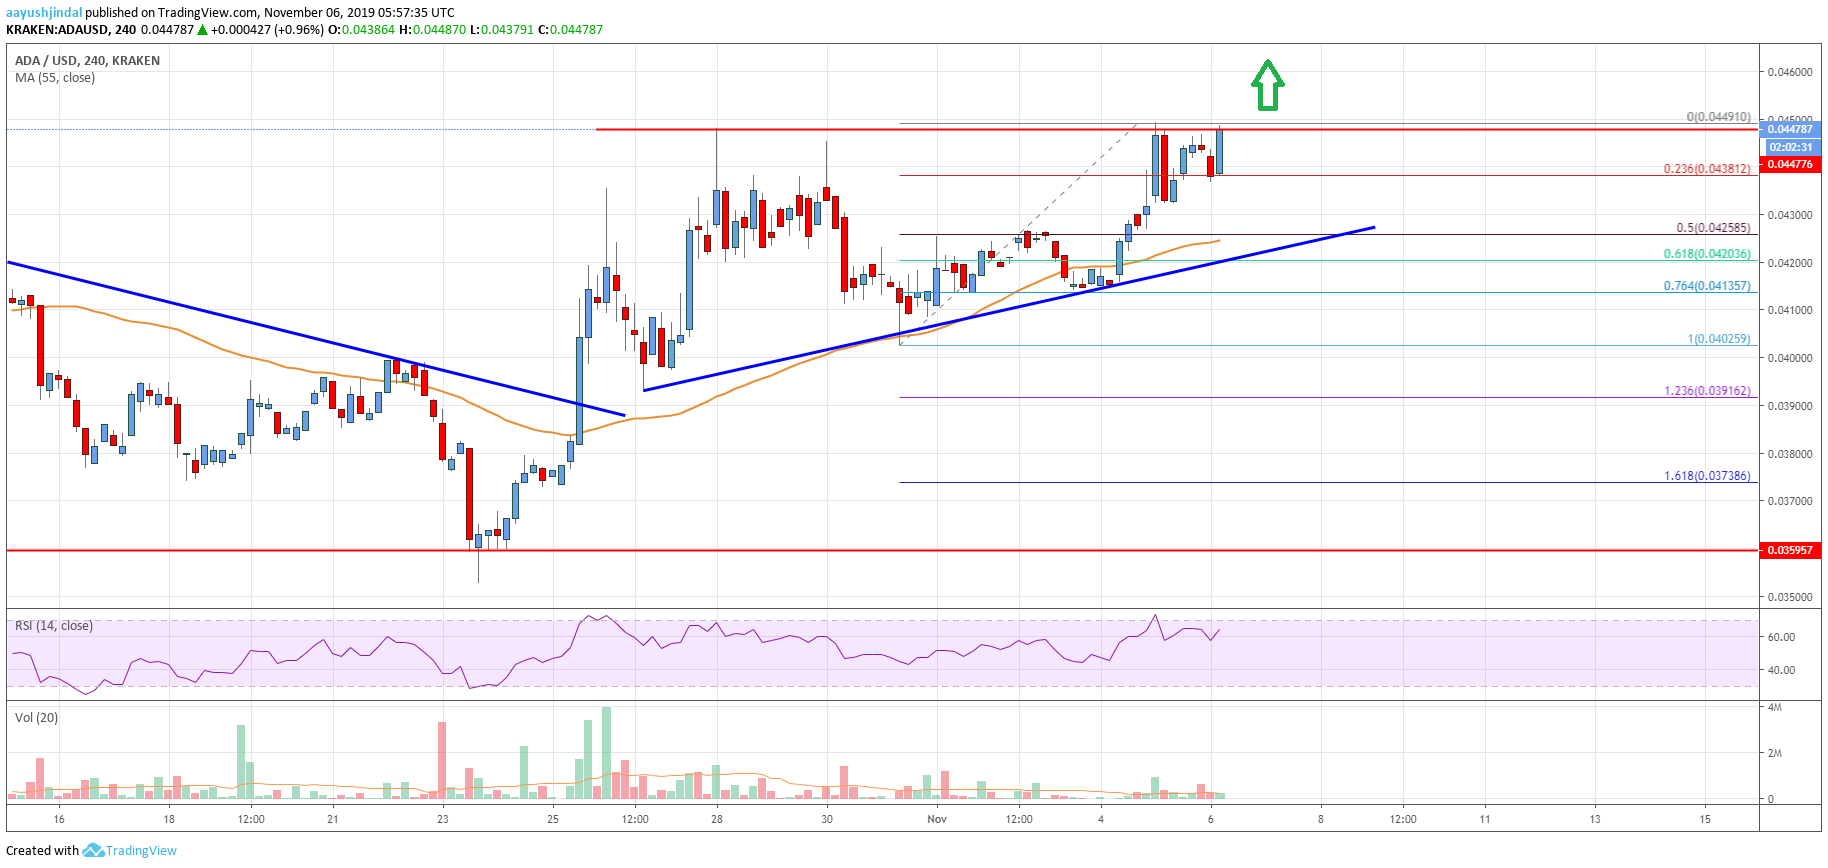
After a successful close above the $0.0400 resistance, cardano price mostly followed a bullish path against the US Dollar. Moreover, ADA/USD broke the $0.0412 and $0.0420 resistance levels.
The price is now trading nicely above the $0.0420 level and the 55 simple moving average (4-hours). At the moment, the price is trading near the key $0.0450 resistance area, which acted as a hurdle for the bulls on a couple of occasions.
The next immediate resistance is near the $0.0450 level. If there is a successful close above the $0.0445 and $0.0450 resistance levels, there are chances of more upsides.
The next key resistances are near $0.0480, above which cardano price could accelerate towards the $0.0500 resistance area. On the downside, an immediate support is near the $0.0438 level.
Besides, the 23.6% Fibonacci retracement level of the recent wave from the $0.0402 low to $0.0449 high is also near the $0.0438 level. The main support on the downside is near the $0.0425 level.
More importantly, there is a key bullish trend line forming with support near $0.0425 on the 4-hours chart. The 55 simple moving average (4-hours) is also near the trend line and $0.0424 to provide support.
Finally, the 50% Fibonacci retracement level of the recent wave from the $0.0402 low to $0.0449 high is near the $0.0425 level. Therefore, the $0.0425 level is a major support for the bulls.
Therefore, a downside break below the $0.0425 support might start a substantial downside correction. In the mentioned case, the price could revisit the $0.0400 support area in the near term.
The chart indicates that ADA price is clearly setting up for more gains above the $0.0445 and $0.0450 resistance levels. If the bulls gain pace above $0.0450, the price is likely to accelerate towards the $0.0480 level. The main hurdle is near the $0.0500 level.
Technical Indicators
4 hours MACD – The MACD for ADA/USD is gaining momentum in the bullish zone.
4 hours RSI – The RSI for ADA/USD is currently well above the 50 level, with a bullish angle.
Key Support Levels – $0.0425 and $0.0405.
Key Resistance Levels – $0.0450 and $0.0480.