- ADA price corrected lower and found support near the $1.040 level against the US Dollar.
- The price is now consolidating above $1.100 support, but it is below the 55 simple moving average (4-hours).
- There was a break above a key bearish trend line with resistance near $1.1350 on the 4-hours chart (data feed via Bitfinex).
- The price is likely to continue higher above the $1.200 unless there is a close below $1.050.
Cardano price is showing positive signs above $1.050 against the US Dollar, while bitcoin is rising. ADA price is likely to start a fresh increase above the $1.200 and $1.220 resistance levels.
Cardano Price Analysis
Cardano price started a strong downside correction from the $1.490 zone against the US Dollar. The ADA/USD pair broke the $1.200 support level to move into a bearish zone.
There was also a close below the $1.200 level and the 55 simple moving average (4-hours). The price traded close to the $1.000 support and a low is formed near $1.036. The price is now consolidating above $1.100 support, but it is below the 55 simple moving average (4-hours).
There was a break above a key bearish trend line with resistance near $1.1350 on the 4-hours chart. The pair is now testing the 23.6% Fib retracement level of the downward move from the $1.490 high to $1.036 low.
An immediate resistance is near the $1.200 level and the 55 simple moving average (4-hours). If there is a clear break above the $1.200 resistance, the price is likely to start a fresh increase. The next key resistance is near the $1.260 zone.
The 50% Fib retracement level of the downward move from the $1.490 high to $1.036 low is also near $1.263 level. Any more gains could lead the price towards the $1.300 and $1.320 levels.
Conversely, the price might fail to climb above $1.200. In the stated case, there is a risk of a fresh decline towards the $1.100 support. The main support is still near the $1.050 and $1.000 levels.
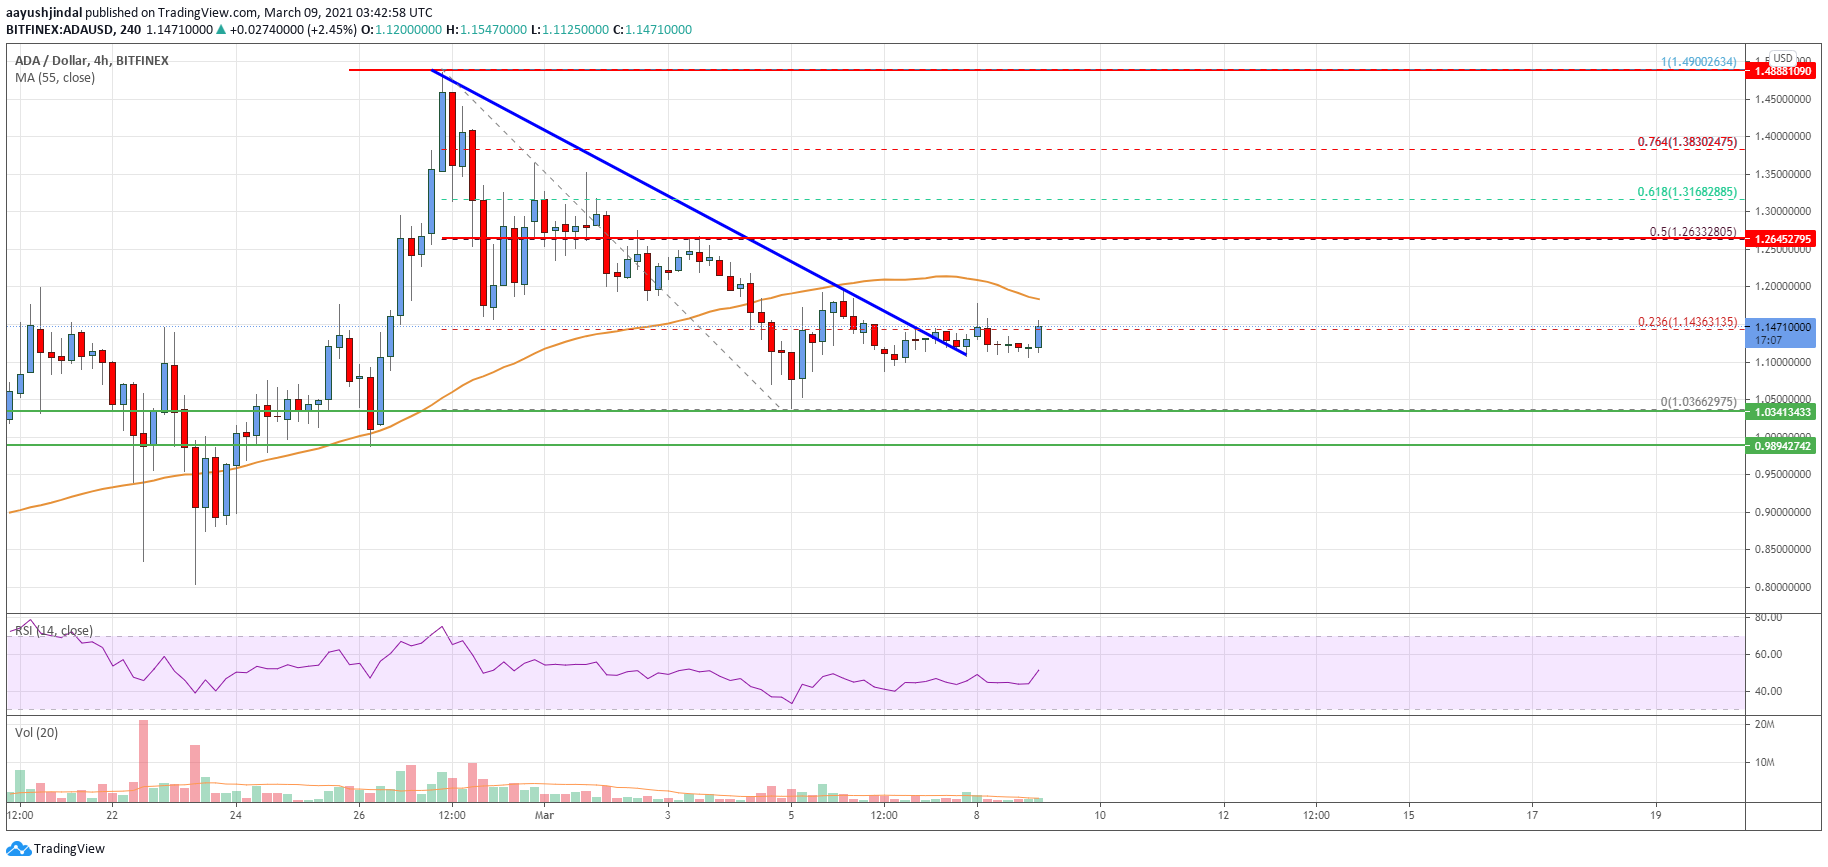
The chart indicates that ADA price is clearly consolidating above $1.100 support, but it is below the 55 simple moving average (4-hours). Overall, the price is likely to continue higher above the $1.200 unless there is a close below $1.050.
Technical Indicators
4 hours MACD – The MACD for ADA/USD is showing positive signs in the bullish zone.
4 hours RSI – The RSI for ADA/USD is now above the 50 level.
Key Support Levels – $1.100 and $1.050.
Key Resistance Levels – $1.200 and $1.260.