- ADA price is showing a lot of positive signs above the $0.1000 support against the US Dollar.
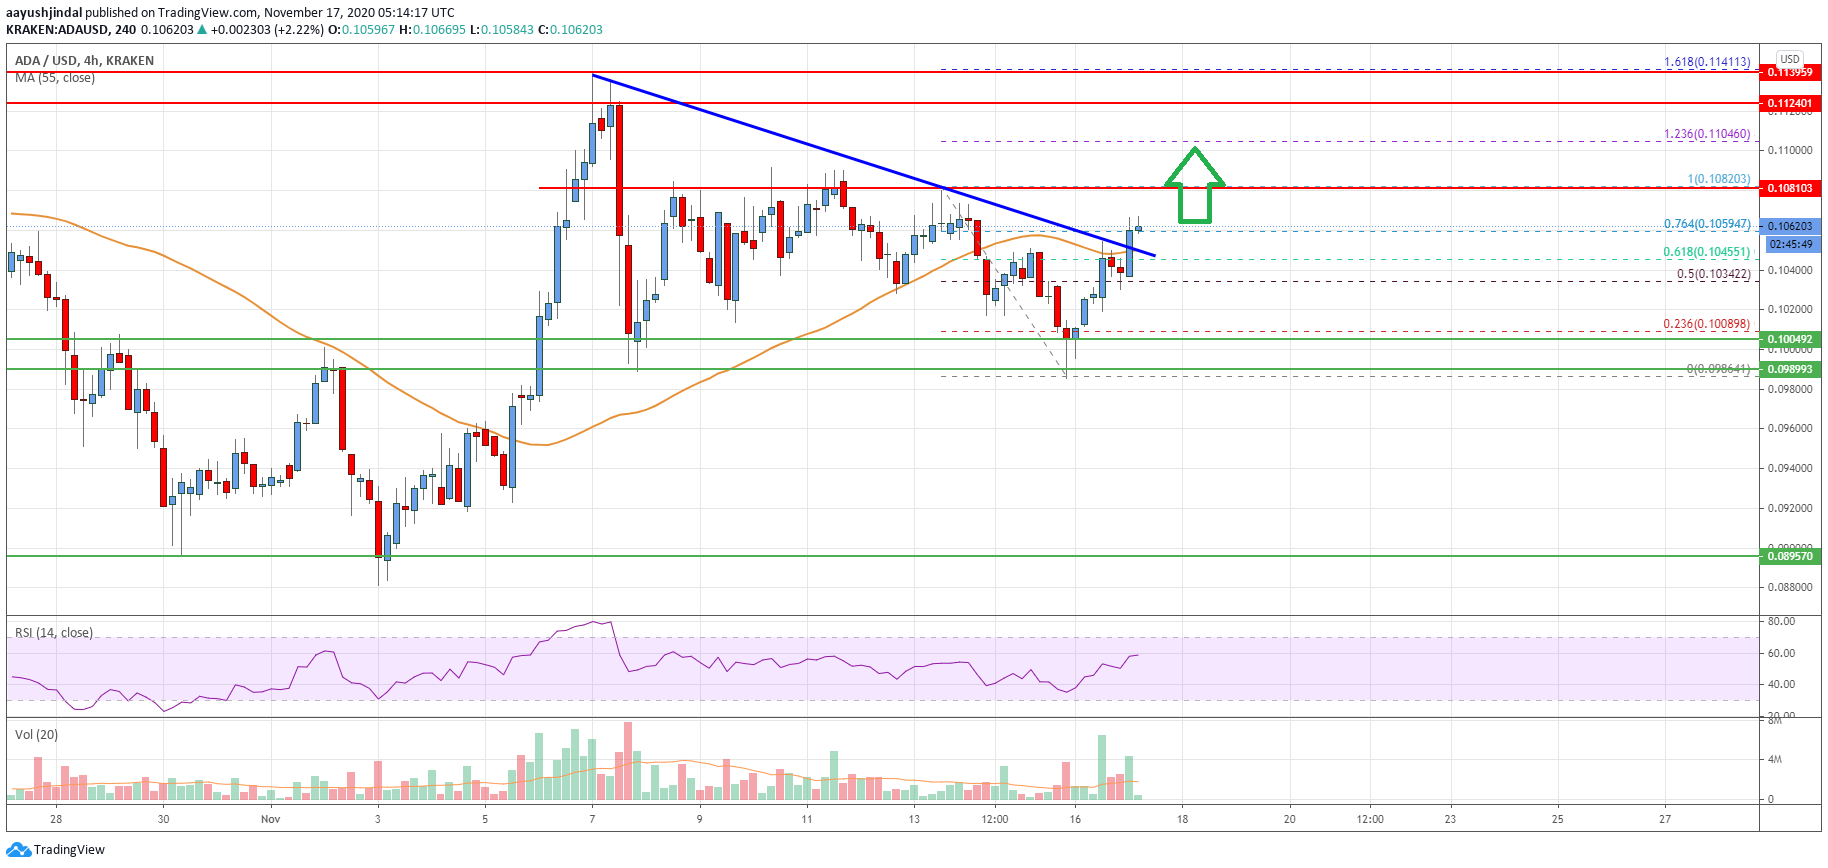
- The price is trading above the $0.1050 level and the 55 simple moving average (4-hours).
- There was a break above a major bearish trend line with resistance near $0.1050 on the 4-hours chart (data feed via Kraken).
- The price is likely to continue higher above the $0.1100 and $0.1120 resistance levels.
Cardano price is slowly gaining pace above $0.1050 against the US Dollar, similar to bitcoin. ADA price is likely to stage a strong rally if it clears the $0.1120 resistance.
Cardano Price Analysis
Cardano price remained well bid above the $0.0980 support zone and it climbed higher against the US Dollar. The ADA/USD pair formed a support base above $0.1000 and recently traded above $0.1020.
There was a break above the 50% Fib retracement level of the recent decline from the $0.1082 high to $0.0986 swing low. Moreover, there was a break above a major bearish trend line with resistance near $0.1050 on the 4-hours chart.
The price is now trading above the $0.1050 level and the 55 simple moving average (4-hours). It is also showing positive signs above the 76.4% Fib retracement level of the recent decline from the $0.1082 high to $0.0986 swing low.
An initial resistance is near the $0.1082 swing high. The first major resistance for the bulls is near the $0.1100 level. A successful close above the $0.1100 and $0.1120 levels could open the doors for a larger increase in the coming days.
In the stated case, the price could test the $0.1145 level. It is close to the 1.618 Fib extension level of the recent decline from the $0.1082 high to $0.0986 swing low.
Conversely, there could be another short-term downside correction below the $0.1050 support level. The first key support is near the $0.1025 level. If there is a downside break, the price could test the $0.1000 support zone.
The chart indicates that ADA price is showing positive signs above the $0.1050 support and the 55 SMA. Overall, the price is likely to continue higher above the $0.1100 and $0.1120 resistance levels in the near term.
Technical Indicators
4 hours MACD – The MACD for ADA/USD is slowly gaining momentum in the bullish zone.
4 hours RSI – The RSI for ADA/USD is currently rising and it is well above the 50 level.
Key Support Levels – $0.1050 and $0.1000.
Key Resistance Levels – $0.1100 and $0.1120.