- ADA price found support near the key $0.0560 and $0.0550 levels against the US Dollar.
- The price recently recovered and climbed above the $0.0600 resistance area.
- There is a key contracting triangle forming with resistance near $0.0640 on the 4-hours chart (data feed via Kraken).
- The price must climb above the $0.0640 and $0.0650 resistance levels to start a fresh increase.
Cardano price is slowly gaining pace above $0.0600 against the US Dollar, similar to bitcoin. ADA price is likely to accelerate gains once it climbs above $0.0650.
Cardano Price Analysis
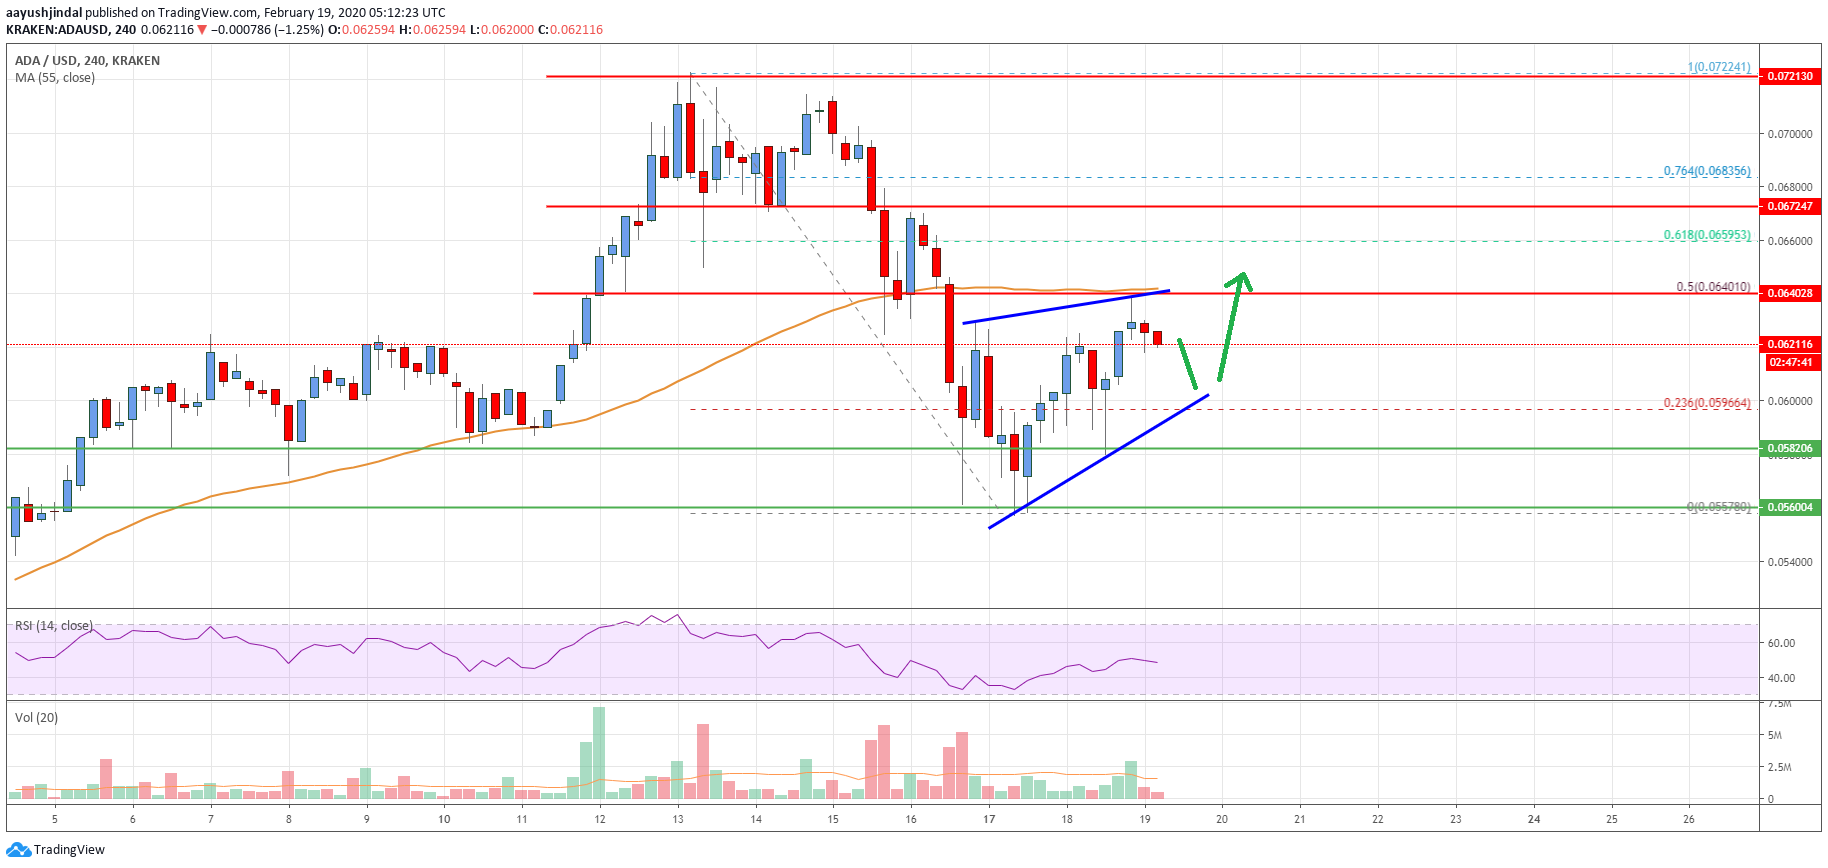
This past week, cardano price corrected lower sharply below $0.0650 and $0.0600 against the US Dollar. The ADA/USD pair even declined below the $0.0580 support and 55 simple moving average (4-hours).
Finally, it tested the $0.0550 support area, where the bulls emerged. A swing low is formed near $0.0557 and the price recently started a strong rise. The price recovered and climbed above the $0.0580 resistance area.
It broke the 23.6% Fibonacci retracement level of the downward move from the $0.0722 high to $0.0557 low. The bulls gained strength above the $0.0620 level, but they struggled to push the price above $0.0640.
It seems like the price is facing a strong hurdle near the $0.0640 level and the 55 simple moving average (4-hours). More importantly, there a key contracting triangle forming with resistance near $0.0640 on the 4-hours chart.
Besides, the 50% Fibonacci retracement level of the downward move from the $0.0722 high to $0.0557 low is also near the $0.0640 level. Therefore, cardano price must climb above the $0.0640 and $0.0650 resistance levels to start a strong upward move.
In the mentioned case, the price is likely to revisit the $0.0700 and $0.0720 resistance levels. An intermediate resistance could be the 76.4% Fibonacci retracement level of the downward move from the $0.0722 high to $0.0557 low.
Conversely, the price might struggle to surpass the $0.0640 resistance. In the mentioned case, there is a risk of another decline towards the $0.0550 support area. Any further losses may perhaps lead the price towards the $0.0500 support area.
The chart indicates that ADA price is slowly moving into a bullish zone above $0.0600. However, the bulls need to gain pace above the $0.0640 and $0.0650 resistance levels to set the stage for a larger rally in the coming sessions.
Technical Indicators
4 hours MACD – The MACD for ADA/USD is currently losing momentum in the bullish zone.
4 hours RSI – The RSI for ADA/USD is still below the 50 level.
Key Support Levels – $0.0600 and $0.0550.
Key Resistance Levels – $0.0640 and $0.0650.