- ADA price is gaining pace above the $2.00 and $2.05 resistance levels against the US Dollar.
- The price is now trading above $2.05 and the 55 simple moving average (4-hours).
- There is a major bullish trend line forming with support near $2.02 on the 4-hours chart (data feed via Bitfinex).
- The price might extend its rally above the $2.20 and $2.25 resistance levels in the near term.
Cardano price is gaining pace above $2.05 against the US Dollar, unlike bitcoin. ADA price must clear $2.20 to start a fresh increase.
Cardano Price Analysis
After forming a base above $1.90, cardano price started a fresh increase against the US Dollar. The ADA/USD pair gained pace for a move above the $2.00 level and the 55 simple moving average (4-hours).
There was a clear break above the $2.05 resistance zone. The bulls were able to clear the $2.12 resistance. A high is formed near $2.17 and the price is now consolidating gains. On the downside, an immediate support is near the $2.12 level.
It is near the 23.6% Fib retracement level of the upward move from the $1.94 swing low to $2.17 high. The first major support is near $2.05. The 50% Fib retracement level of the upward move from the $1.94 swing low to $2.17 high is also near the $2.05 level.
Any more losses might lead the price towards the $2.00 level. There is also a major bullish trend line forming with support near $2.02 on the 4-hours chart. A close below the $2.00 level might spark more downsides. The next support is near $1.92, below which the bears could gain strength in the near term.
On the upside, an initial hurdle is near the $2.18 level. The first key resistance is near the $2.20 level. The main resistance is forming near $2.25. If there is an upside break above the $2.25 zone, the price could rally above $2.30. The next major resistance could be near the $2.50 level.
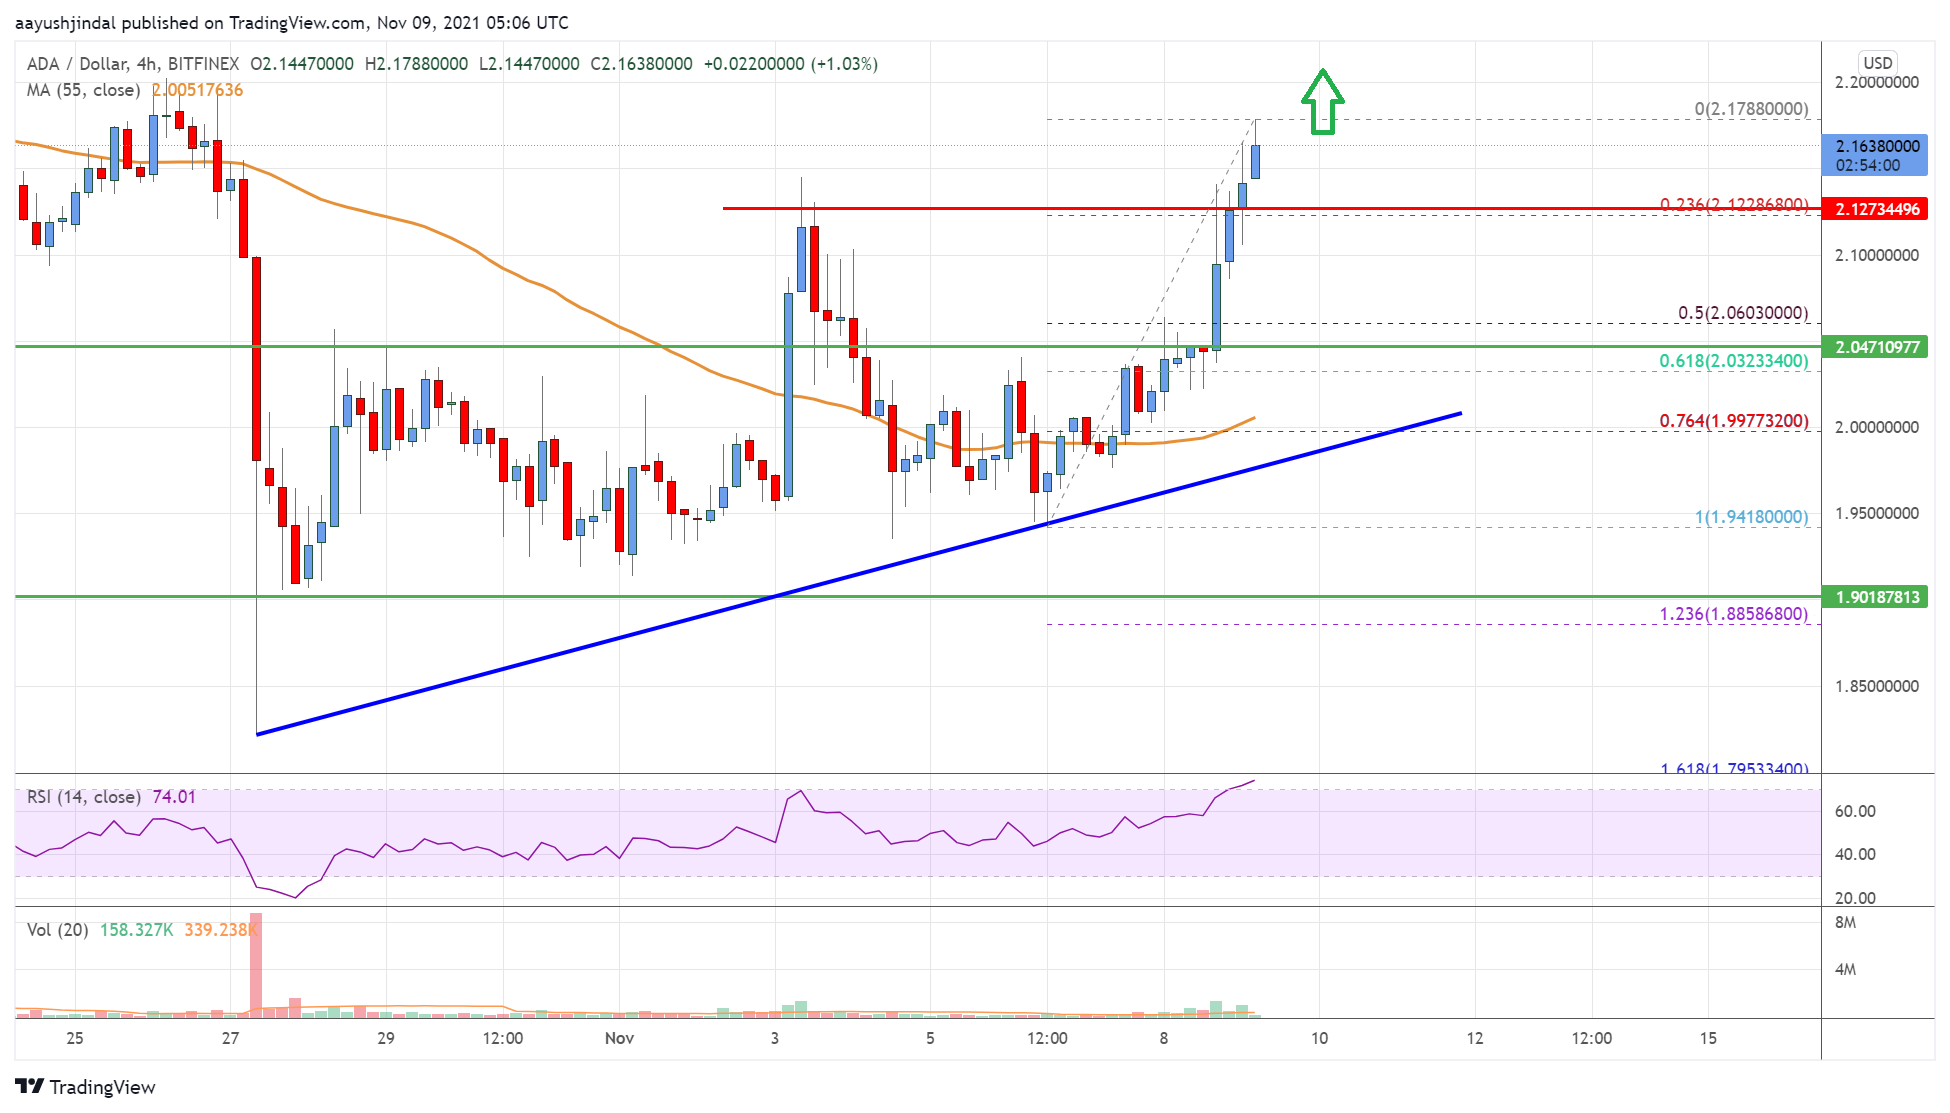
The chart indicates that ADA price is now trading above $2.05 and the 55 simple moving average (4-hours). Overall, the might extend its rally above the $2.20 and $2.25 resistance levels in the near term.
Technical Indicators
4 hours MACD – The MACD for ADA/USD is moving in the bullish zone.
4 hours RSI – The RSI for ADA/USD is rising above the 60 level.
Key Support Levels – $2.12 and $2.05.
Key Resistance Levels – $2.20 and $2.25.