- ADA price started a steady decline from the $0.0900 resistance zone against the US Dollar.
- The price tested the $0.0700 support area and it is currently correcting higher.
- There is a major bearish trend line forming with resistance near $0.0800 on the 4-hours chart (data feed via Kraken).
- The price must clear the $0.0800 resistance and the 55 simple moving average (4-hours) for a fresh increase.
Cardano price is facing a couple of key hurdles against the US Dollar and bitcoin. ADA price might start a strong upward move if it clears the $0.0800 resistance zone.
Cardano Price Analysis
Earlier this week, cardano price started a major increase from the $0.0900 resistance zone against the US Dollar. The ADA/USD pair declined steadily below the $0.0800 support and the 55 simple moving average (4-hours).
The price traded to a new monthly low at $0.0689 before starting an upside correction. There was a decent recovery wave above the $0.0750 resistance zone, but the price is facing a major hurdle near the $0.0800 level.
There is also a major bearish trend line forming with resistance near $0.0800 on the 4-hours chart. The recent high was formed near $0.0804 and the price is currently consolidating gains. It is testing the 23.6% Fibonacci retracement level of the upward move from the $0.0689 low to $0.0804 high.
On the downside, there is a key support forming near the $0.0750 level. The 50% Fibonacci retracement level of the upward move from the $0.0689 low to $0.0804 high is also near the $0.0750 zone and it might act as a major buy zone.
If there are more losses below $0.0750, cardano price could accelerate lower towards the $0.0720 and $0.0700 support levels in the near term.
Conversely, the price could break the trend line resistance at $0.0800 to start a steady rise. The next key resistance could be near the $0.0820 level, above which the bulls are likely to aim a retest of the main $0.0900 resistance zone. Any further gains could lead the price towards the $0.0950 level.
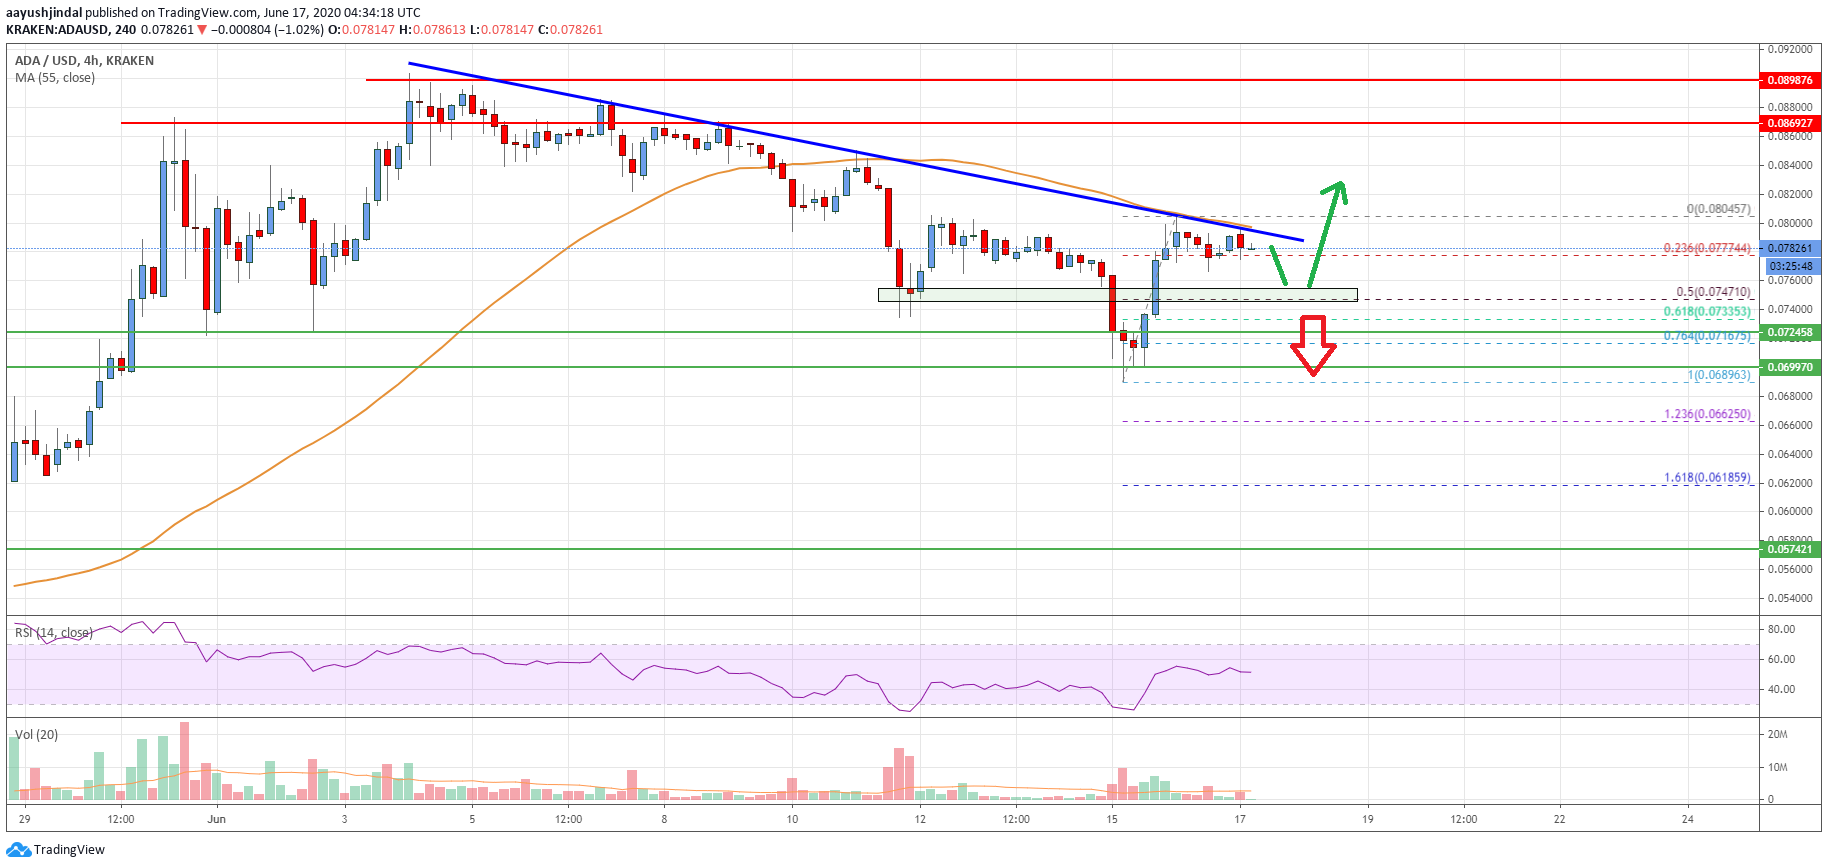
The chart indicates that ADA price is trading near a major resistance at $0.0800. It could either start a strong rally towards $0.0900 or resume its decline below the $0.0750 support zone.
Technical Indicators
4 hours MACD – The MACD for ADA/USD is currently fading in the bullish zone.
4 hours RSI – The RSI for ADA/USD is currently just above the 50 level.
Key Support Levels – $0.0750 and $0.0720.
Key Resistance Levels – $0.0800 and $0.0900.