- ADA price gained traction after it broke the key $0.0380 resistance against the US Dollar.
- The price traded towards the $0.0420 resistance and formed a high at $0.0427.
- There is a key bullish trend line forming with support near $0.0382 on the 4-hours chart (data feed via Kraken).
- The price could correct in the short term, but dips remain well supported near $0.0400 and $0.0380.
Cardano price is trading in a bullish zone against the US Dollar, similar to bitcoin. ADA price is likely to continue high above $0.0420 and $0.0450 in the near term.
Cardano Price Analysis
After forming a support base near the $0.0350 level, cardano price started a steady rise against the US Dollar. The ADA/USD pair broke the key $0.0380 resistance level to move into a positive zone.
Moreover, the price settled above $0.0380 and the 55 simple moving average (4-hours). Finally, it broke the $0.0400 level and traded towards the $0.0420 resistance area. A high is formed near $0.0427 and the price is currently correcting lower.
It broke the 23.6% Fibonacci retracement level of the recent rally from the $0.0366 low to $0.0427 high. However, there are many supports on the downside near the $0.0400 and $0.0385 levels.
The $0.0400 support also coincides with the 50% Fibonacci retracement level of the recent rally from the $0.0366 low to $0.0427 high. Besides, there is a key bullish trend line forming with support near $0.0382 on the 4-hours chart.
More importantly, the 55 simple moving average (4-hours) is also near the trend line to provide support. Therefore, cardano price is likely to find a strong buying interest near the $0.0400 and $0.0382 levels if it corrects further from the current levels.
Any further losses may perhaps lead the price towards the main $0.0350 support area in the near term. Conversely, the price is likely to continue higher above the $0.0420 and $0.0427 levels.
The next key resistance is near the $0.0450 level, above which the bulls are likely to aim a test of the $0.0500 barrier in the coming days.
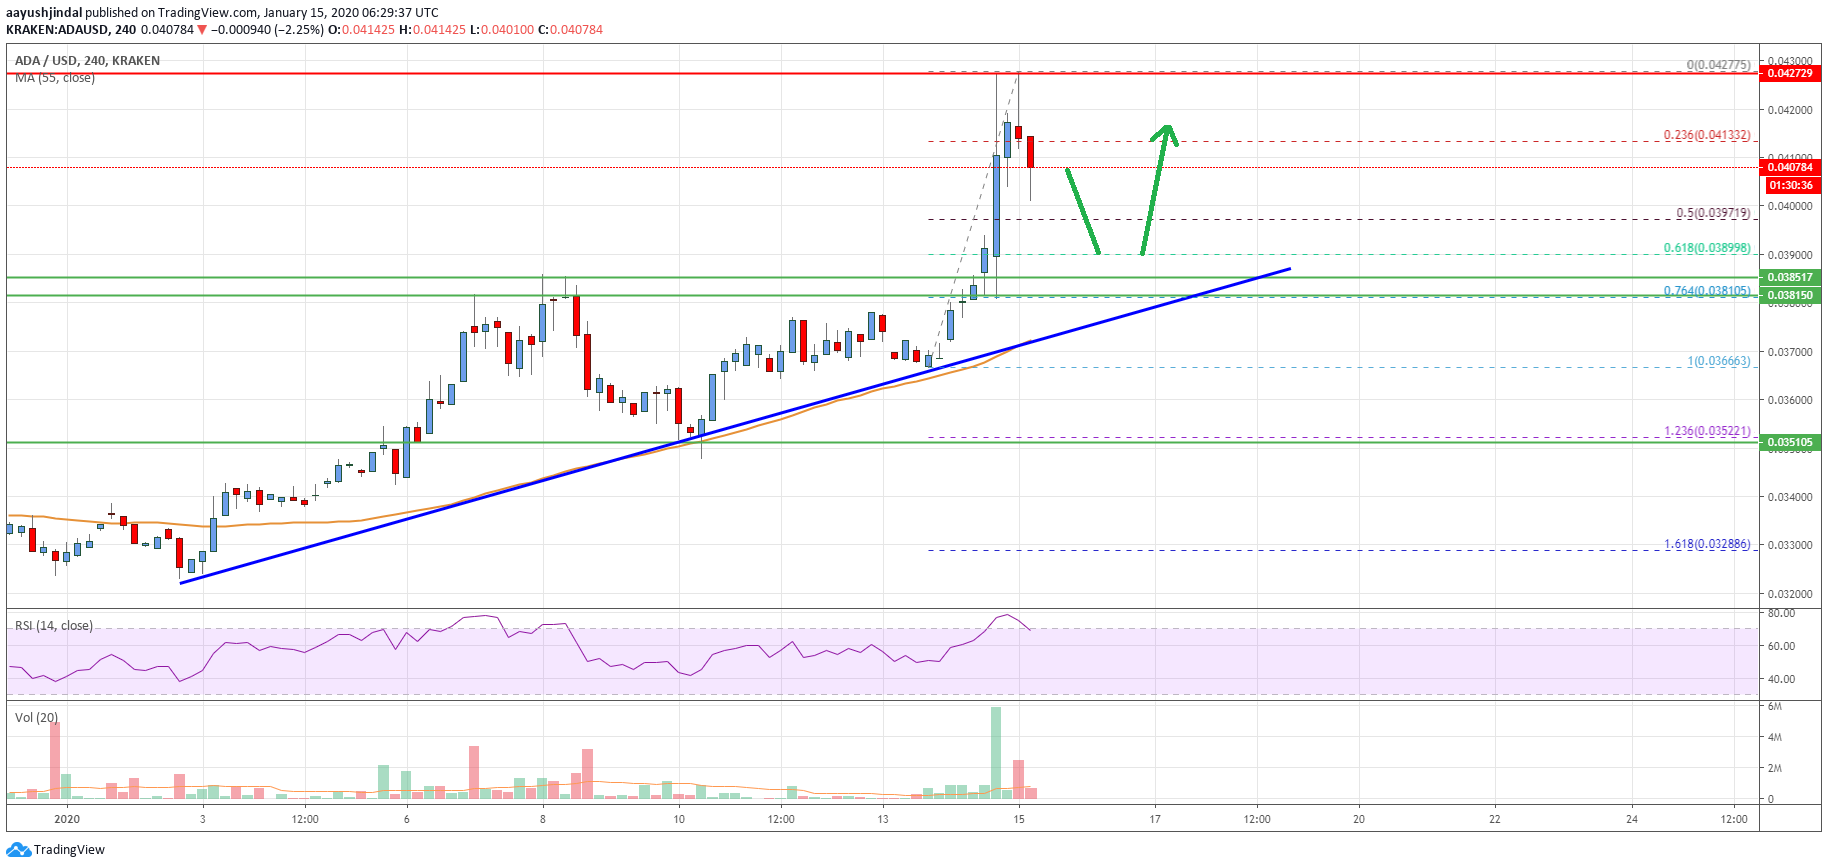
The chart indicates that ADA price is trading in a nice uptrend above the $0.0380 support. In the short term, there could be a downside correction below $0.0400 and $0.0395. However, as long as the price is above $0.0380, it is likely to climb higher again above the $0.0427 and $0.0450.
Technical Indicators
4 hours MACD – The MACD for ADA/USD is slowly losing pace in the bullish zone.
4 hours RSI – The RSI for ADA/USD is currently correcting lower from the 80 level.
Key Support Levels – $0.0400 and $0.0382.
Key Resistance Levels – $0.0420 and $0.0450.