- ADA price is gaining pace above the $0.0620 resistance area against the US Dollar.
- The price recently broke the $0.0650 level and it could continue to rise in the near term.
- There is a major bullish trend line forming with support near $0.0610 on the 4-hours chart (data feed via Kraken).
- The price is likely to surpass the $0.0700 resistance and continue higher in the near term.
Cardano price is trading in a strong uptrend above $0.0600 against the US Dollar, similar to bitcoin. ADA price could soon test the $0.0800 resistance area.
Cardano Price Analysis
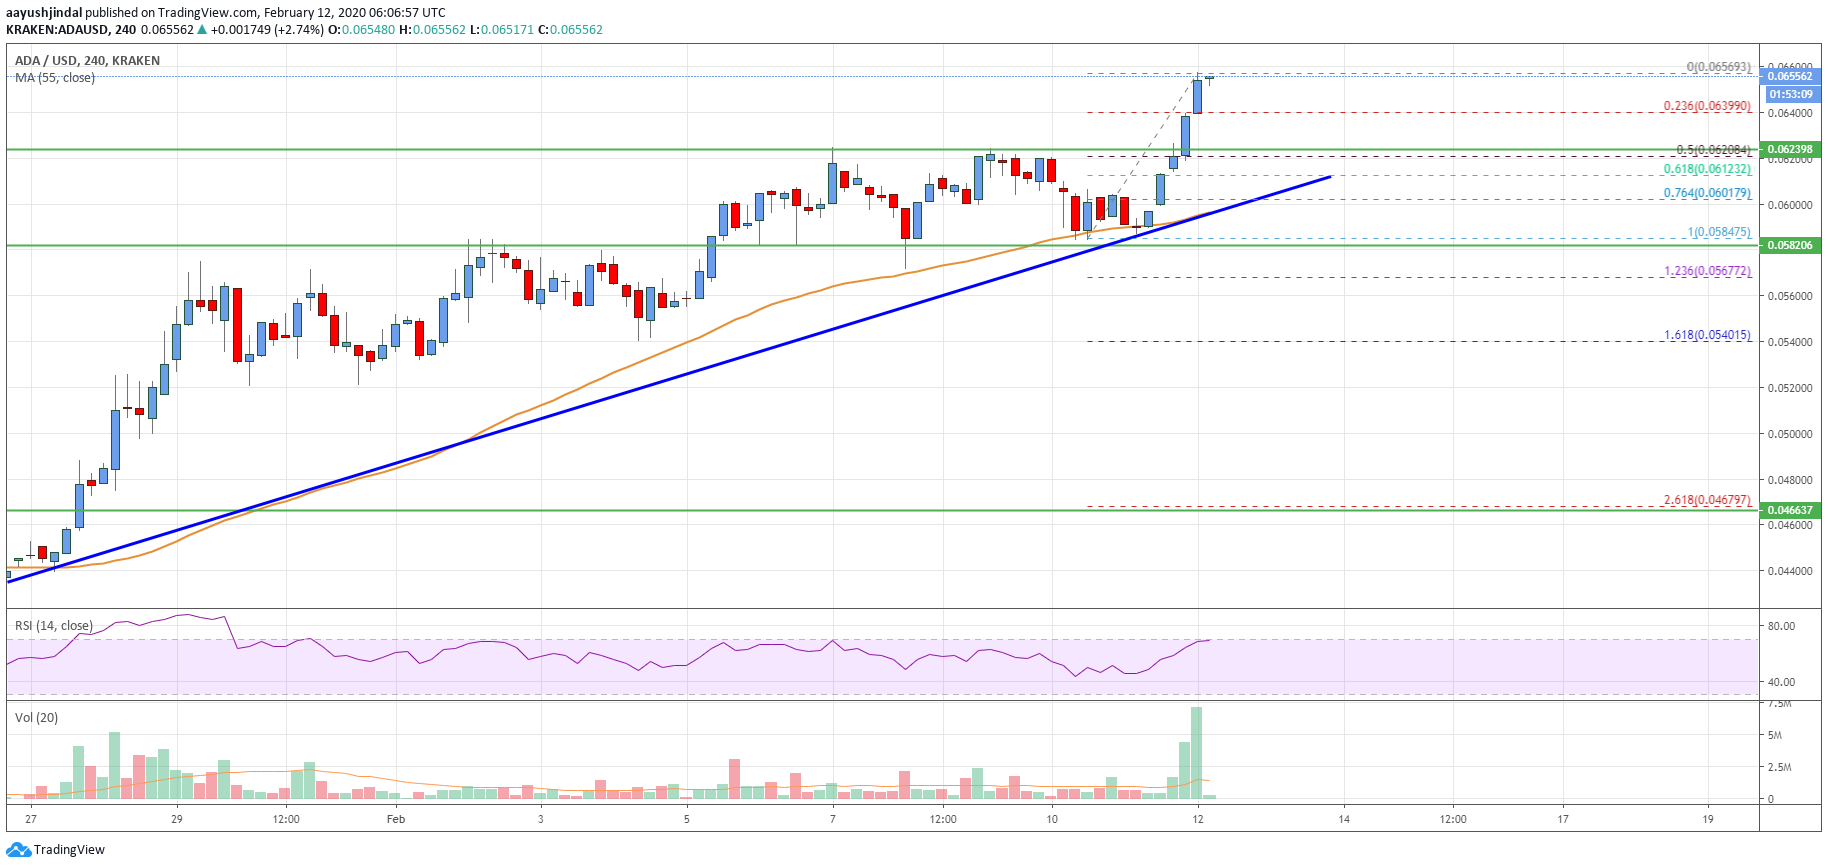
In the past few days, cardano price remained in a nice uptrend above $0.0550 against the US Dollar. The ADA/USD pair even climbed above the $0.0620 resistance and the 55 simple moving average (4-hours).
Finally, it broke the $0.0650 resistance and traded to a new 2020 high at $0.0656. It is currently rising and it might continue to rise towards $0.0700. If there is a downside correction, an initial support is near the $0.0640 level.
It represents the 23.6% Fibonacci retracement level of the recent upward move from the $0.0584 low to $0.0656 high. The main support on the downside is now near the $0.0620 level.
More importantly, there is a major bullish trend line forming with support near $0.0610 on the 4-hours chart. An intermediate support is near the 50% Fibonacci retracement level of the recent upward move from the $0.0584 low to $0.0656 high.
Therefore, if cardano price corrects lower, it is likely to find support near the $0.0620 and $0.0610 levels. Any further losses could lead the price towards the $0.0600 support.
On the upside, an initial resistance is near the $0.0680 level, followed by $0.0700. If the bulls able to gain strength above $0.0700, there are chances of a strong rise in the coming sessions.
The next target for the bulls may perhaps be near the $0.0800 level. Any further upsides could lead the price towards the all-important $0.1000 resistance area.
The chart indicates that ADA price is following a nice bullish path above the $0.0620 and $0.0610 support levels. On the upside, a clear break above the $0.0680 level might set the pace for a larger upward move.
Technical Indicators
4 hours MACD – The MACD for ADA/USD is now gaining momentum in the bullish zone.
4 hours RSI – The RSI for ADA/USD is currently well above the 60 level.
Key Support Levels – $0.0620 and $0.0610.
Key Resistance Levels – $0.0700 and $0.0800.