Traders took a wild ride on the bitcoin price roller coaster last week, as although bitcoin managed to record another historical high of $2,691 a few days ago, it started dropping to reach a low of $1,815 last Saturday, before climbing up again to $2,130 at the time of writing of this analysis.
So, where will bitcoin price be heading during the upcoming week? Will the bullish wave that has been controlling the market since late March push price to even higher levels?
New Support Levels Evident On the 1 Day BTCUSD Chart:
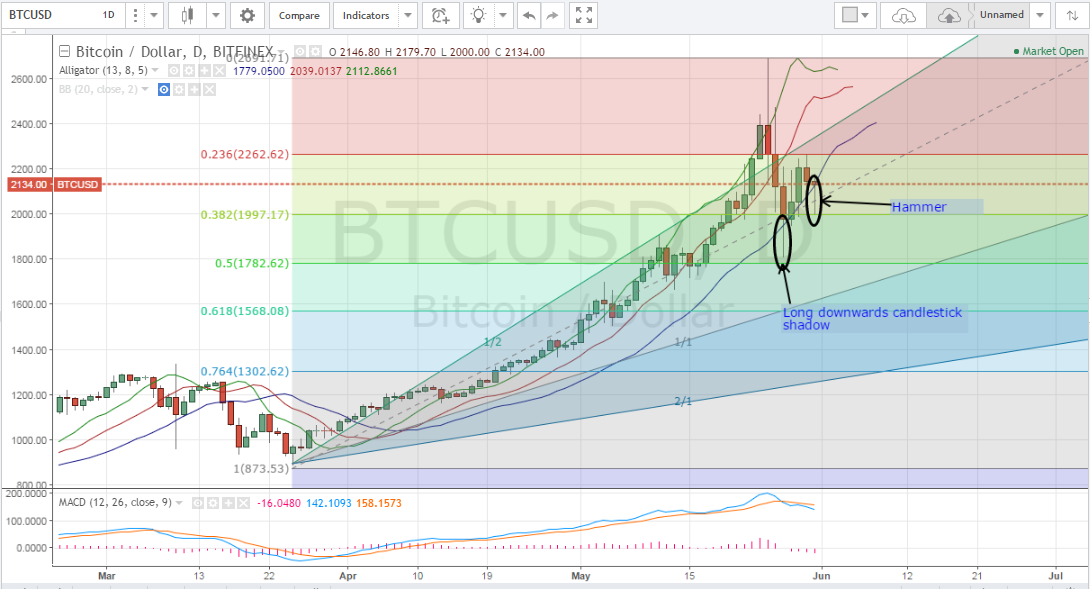
Let’s examine the 1 day BTCUSD chart from Bitfinex, while plotting the Williams Alligator and the MACD indicators (look at the below chart), we can notice the following:

- To determine key support and resistance levels at this period, we will plot FIbonacci retracements that extend between the low recorded on March 25th, 2017 ($873.53) and the high recorded on May 25th, 2017 ($2,691.71).
- On Saturday, after recording the day’s low ($1,815), the downtrend was reversed and bitcoin started rising again. This reflects the strong support received as price approached the 50% Fib retracement level which corresponds to $1,782. This is evidenced by the long downwards shadow of the candlestick representing last Saturday’s trading session (look at the above chart).
- Even though price has been rising since last Saturday, the uptrend was halted by the 23.6% Fib retracement level which corresponds to $2,262.62; that’s why price dropped after reaching $2,240 on Sunday. Bitcoin price failed to break through this critical resistance level also on Monday.
- Right now, bitcoin price is receiving significant support from the 38.2% Fibonacci retracement level around $1997.17 as shown by the “hammer” forming and the long downwards shadow of the candlestick that represents today’s trading session.
- As per our previous Gann angle placements, bitcoin price is now moving between the 1 x 2 and 1 x 1 angles, which reflects relative market stability. As shown on the above chart, May’s bullish wave was reversed when bitcoin price broke through the 1 x 2 Gann angle and downwards price movement pulled price down below the 1 x 2 Gann angle where the market would be more stable.
- The Williams Alligator Indicator’s SMAs are still exhibiting a bullish signal; the green SMA is above the red SMA and both of them are above the blue SMA. Moreover, the MACD indicator is in the positive territory valuing 160 at the moment, yet the blue positive trend line is moving below the red negative trend line. I recommend refraining from opening new long positions until the blue positive trend line crosses above the red negative trend line.
Conclusion:
Bitcoin price took somehow a nosedive last week, recording a week low of $1,815, before rising gradually again to $2,130. Our technical analysis predicts bitcoin price to continue rising to test the resistance around the 23.6% Fibonacci retracement level ($2,262.62) during the upcoming week. If this critical resistance level is breached, we can see bitcoin price rise towards the next resistance level near $2,691.71
Chart from Bitfinex, hosted on Tradingview.com


