The previous week has been the most bullish week for bitcoin since the genesis block was first mined, as its price gained around $1,300 during the past 7 days, jumping from $4,338 to $5,638 as this analysis is being written. After recording a high of $5,930, the bullish rally was halted and a downwards price correction movement can now be spotted on the charts, as the market’s traders and speculators are collecting their profits.
So, where do we expect bitcoin price to be heading during the upcoming week?
Confirmation of Reversal of the Bullish Wave On the 4 Hour BTCUSD Chart:
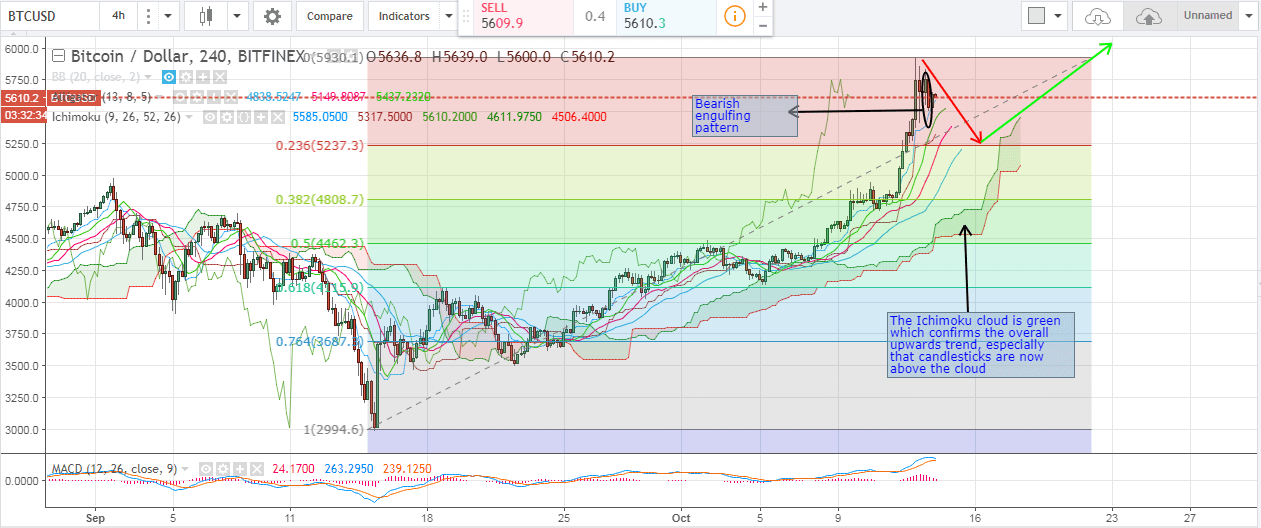
Let’s examine the 4 hour BTCUSD chart from Bitfinex, while plotting the Williams Alligator, MACD indicator and the Ichimoku cloud chart (look at the below chart). We can note the following:
Note: The Ichimoku cloud is a special chart that is used by technical analysts to determine key resistance and support levels; the momentum of price movements and the direction of price movement of an asset. It is formulated to provide useful info via using moving averages (kijun-sen and tenkan-sen) to identify bearish and bullish crossover points. When plotted on 1 day charts, the clouds are created between the spans of the averages of the kijun-sen and the tenkan-sen plotted for the upcoming 6 months (senkou span B), along with the midpoint of the 52 week low and high plotted for the upcoming six months too (senkou span B). For more information about the Ichimoku cloud, refer to investopedia.

- We can plot a Fibonacci retracement between the low recorded on the 15th of September ($2,994.6) and the high recorded on the 13th of October ($5,930.1) to identify key resistance and support levels. After recording a new historical high was recorded yesterday ($5,930.1), an atypical “bearish engulfing” pattern was formed (look at the 2 candlesticks highlighted by an ellipse on the above chart), signaling reversal of the bullish rally as downwards price correction began. As such, we can expect price to drop down to 23.6% Fib retracement, which corresponds to $5,237.3, before price can continue rising again.
- The downwards price correction movement will be more or less limited, especially that the SMAs of the Williams Alligator are still exhibiting a bullish alignment (the red SMA is above the blue SMA and the green SMA is above both). Moreover, the MACD indicator is also bullish as the blue positive trend line is moving above the red negative trend line and both of them are in the positive territory.
- The Ichimoku cloud confirms the overall upwards trend as price is now above the cloud. Also, the cloud is green which confirms that the overall trend is still bullish, even though downwards price correction is taking place.
Conclusion:
Last week represented the most bullish week for bitcoin since the genesis block was first mined, as it gained around $1,300 in less than 7 days. Our technical analysis is in favor of a short downwards price correction movement that might take price downwards to the level of the 23.6% Fib retracement. However, the overall trend is still bullish, so bitcoin price will mostly exceed the $6,000 mark during the upcoming week.
Chart from Bitfinex, hosted on Tradingview.com


