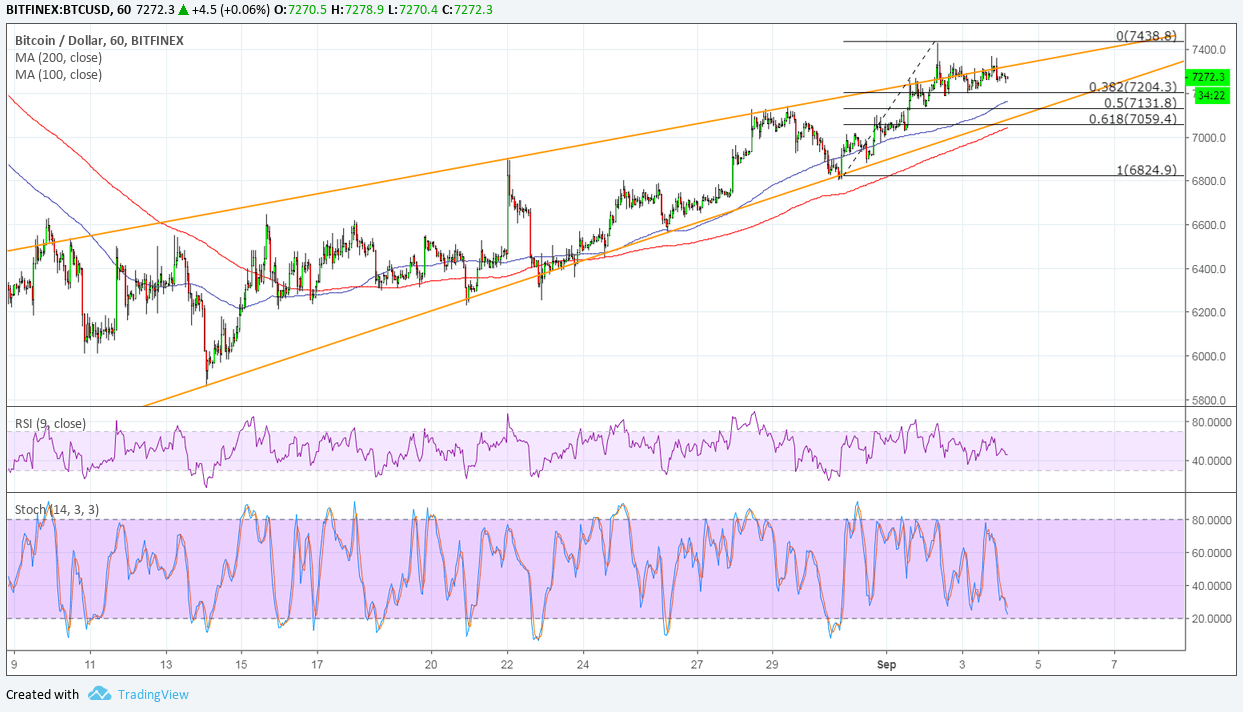
Bitcoin is still stuck inside its rising wedge pattern on the short-term time frames but is making another attempt to break out. Price has been hovering around the resistance for quite some time and forming higher lows.
However, RSI is pointing down to signal that sellers are regaining the upper hand and could drag price down. Stochastic is also heading south to show that sellers are in control, but the oscillator is nearing oversold levels to reflect exhaustion. Turning back up could bring buyers in and push for a break higher.
The 100 SMA is still above the longer-term 200 SMA to confirm that the path of least resistance is to the upside. In other words, the uptrend is more likely to resume than to reverse the 100 SMA also lines up with the 50% Fibonacci retracement level at $7,131 while the 61.8% Fib is near the 200 SMA dynamic support at the bottom of the wedge.
A candle closing below the $7,000 mark could be enough to confirm a bearish break and a resulting downtrend for Bitcoin. On the other hand, a move past the $7,500 area could indicate a bullish break. This could spur a rally that’s roughly the same height as the wedge.

Bitcoin bulls found encouragement from upbeat forecasts of Satis ICO Research Advisory group as it predicted that price could hit $96K in the next five years. It also predicts that Bitcoin could hit $32,914 in 2019.
However, traders still seem to be holding out for the SEC ruling on Bitcoin ETFs while keeping this particular cryptocurrency supported. This decision by the regulator could have a strong impact on volumes and activity for the rest of the year, so it could determine whether the highly-anticipated rebound will materialize or not.
Zooming out to longer-term charts shows that Bitcoin is on the verge of forming a double bottom and testing the neckline. An upside break could confirm that a larger uptrend is in the works.
Images courtesy of TradingView.


