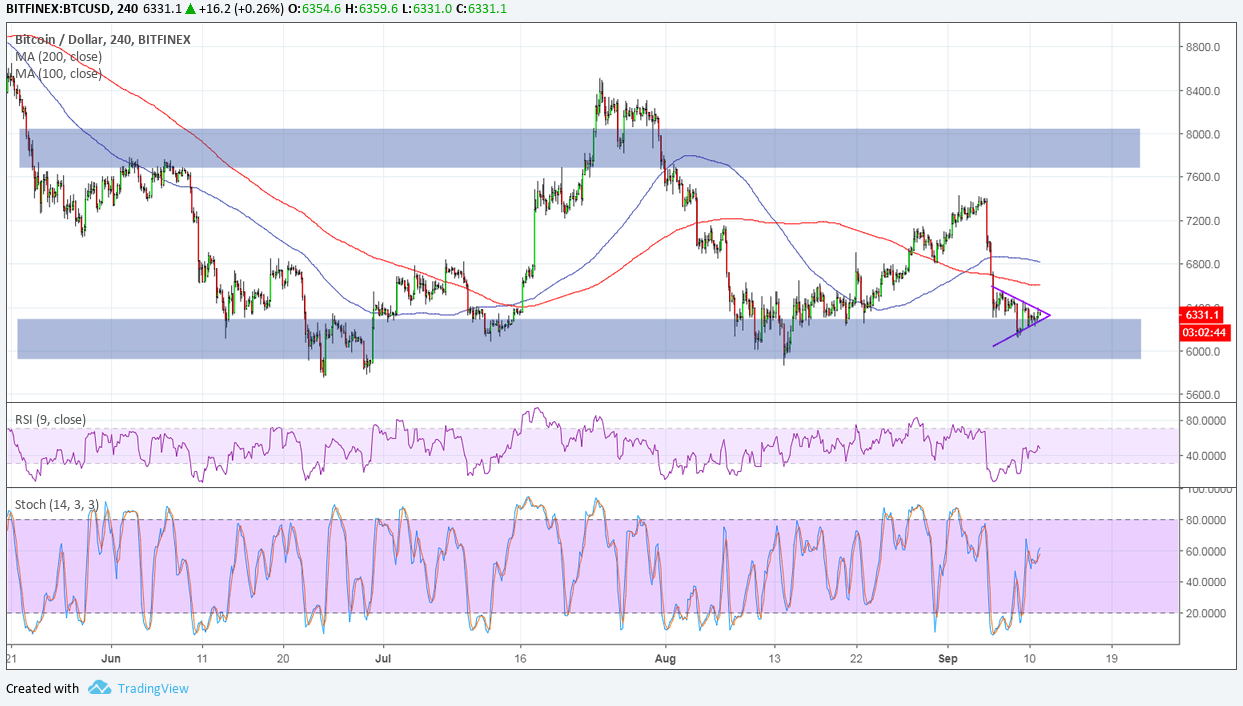
Bitcoin recently kicked off the week with a sharp tumble and is now pausing from the slide inside a small consolidation pattern. For some, this could be a bearish flag, which is often seen as a continuation signal from the earlier drop.
The 100 SMA is above the longer-term 200 SMA on this time frame to signal that the path of least resistance is still to the upside. In other words, support is more likely to hold than to break. Besides, the price is hovering just above the long-term floor around the $5,800 to $6,000.
A break below this consolidation, however, could pave the way for even longer-term losses, possibly lasting by more than a $1,000 or the same height as the flag’s mast. RSI is still pointing up to indicate that there’s some bullish pressure left. Similarly stochastic is heading higher so bitcoin could still follow suit until the oscillator hits overbought levels.
Bitcoin bulls and bears continue to battle it out as the price is hovering above the key support area once more. Bulls have strongly defended this level twice already, but the formation of lower highs has indicated that selling pressure is getting stronger.
A break below this support might even spur a slide that’s the same height as the earlier range, which spans roughly $2,000. On the other hand, a break above the short-term consolidation pattern could put bitcoin back on track towards testing the $8,000 mark again.
Keep in mind, however, that sentiment hasn’t favored Bitcoin and its peers to start the week as the SEC suspension on a couple of crypto-backed securities has filled headlines. Although there have been positive developments in the industry, the early selloff appears to have dampened sentiment and expectations that the bitcoin ETF applications could be approved.
Images courtesy of TradingView


