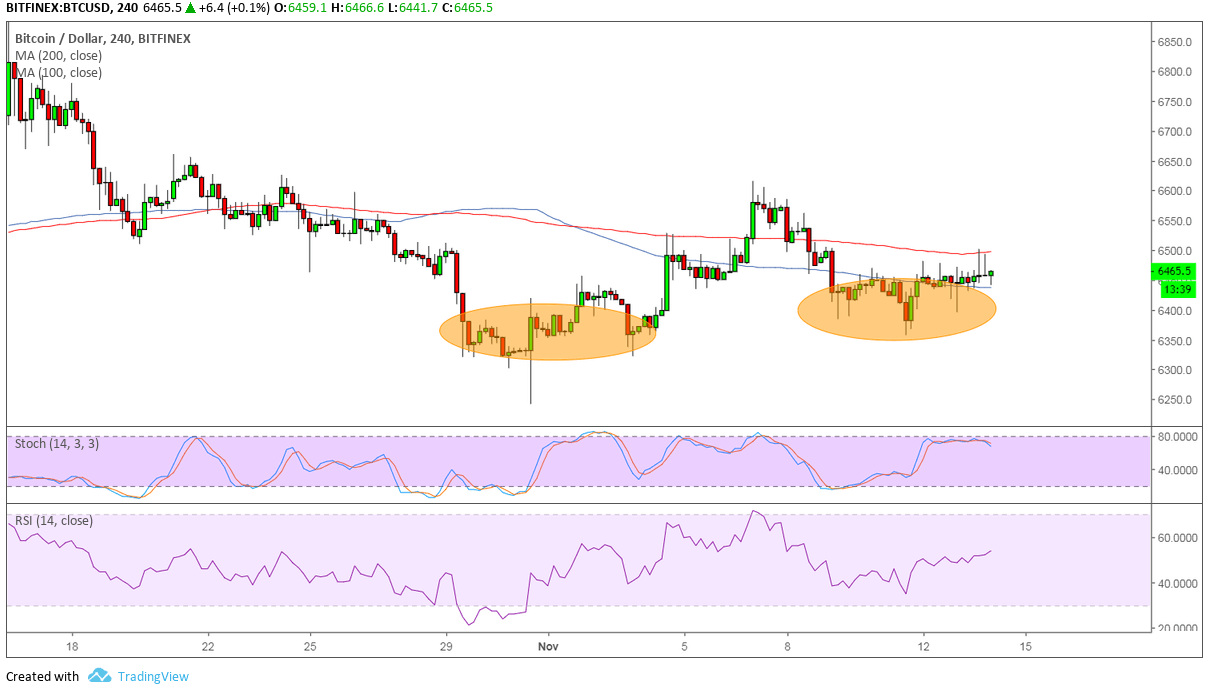
Bitcoin could be done with its slide as it forms a complex double bottom on its 4-hour time frame. Price failed in its last two attempts to close below the $6,300 area, creating a potential reversal pattern with the neckline at $6,600-6,700.
A break past this resistance could lead to an uptrend that’s at least the same height as the chart formation. However, the 100 SMA is below the longer-term 200 SMA to signal that the path of least resistance is to the downside. In other words, there’s a stronger chance for the selloff to resume than to reverse. Also, the 200 SMA is currently holding as dynamic resistance.
Stochastic already seems to be topping out and ready to move back down without even hitting overbought territory. This signals that sellers are eager to return and push the price back down, possibly until the earlier lows around $6,250. RSI, on the other hand, appears ready to climb and has a lot of ground to cover before indicating overbought conditions.

Bitcoin is being pulled in opposite directions by market sentiment and industry developments. Risk aversion has been present in the general financial markets on account of higher US borrowing costs and geopolitical risks stemming from Brexit, Italy’s debt, crude oil supply, and trade tensions.
Still, some have pointed out that Bitcoin can have a tendency to profit from these scenarios. After all, cryptocurrencies could offer higher returns even while stocks and commodities are in the red. Besides, it has also been highlighted how Bitcoin and its peers could be immune to risks weighing on fiat currencies.
Bitcoin also has stronger institutional volumes to look forward to. However, some regulatory action is keeping traders on edge. It has been noted that larger volumes of Bitcoin are being moved from exchanges to wallets as the SEC cracks down on decentralized platforms.
Images courtesy of TradingView


