- Bitcoin price traded to a new 2020 high at $9,620 before it started correcting lower against the US Dollar.
- The price traded below the $9,500 level and even spiked below the $9,210 support area.
- There is a major bullish trend line forming with support near $9,105 on the 4-hours chart of the BTC/USD pair (data feed from Coinbase).
- The pair could either rally again above $9,300 or it might dip towards the $8,840 support area.
Bitcoin price rallied towards the $9,650 level before correcting lower against the US Dollar. BTC is now trading near the key $9,100 and $9,000 support levels.
Bitcoin Price Analysis
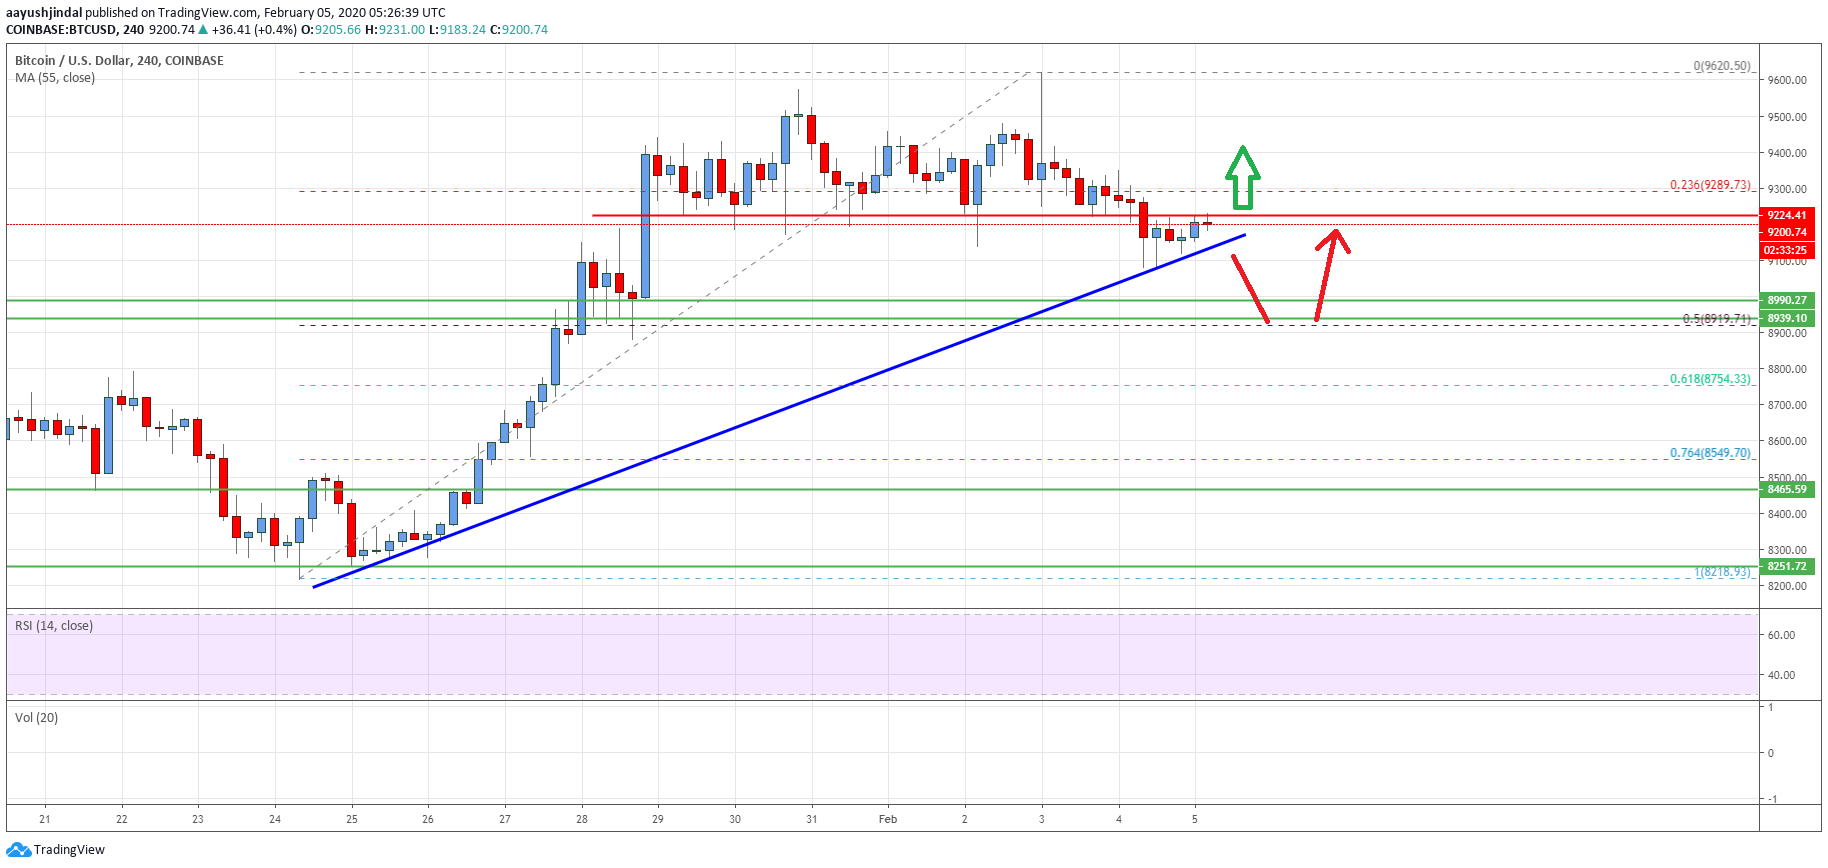
After a successful break above the $9,500 level, bitcoin price extended its upward move above the $9,600 level against the US Dollar. BTC even settled above the $9,300 level and the 55 simple moving average (4-hours).
Finally, the price traded to a new 2020 high at $9,620 before the bears took control. As a result, there was a downside correction below the $9,500 and $9,420 levels.
Moreover, there was a break below the 23.6% Fib retracement level of the major rally from the $8,218 low to $9,620 high. More importantly, the price spiked below the key $9,210 and $9,200 support levels.
However, the $9,100 area is acting as a decent support. Besides, there is a major bullish trend line forming with support near $9,105 on the 4-hours chart of the BTC/USD pair. If there is a downside break below the trend line support, there is a risk of more losses below $9,100.
The next major support is near the $8,990 and $8,940 levels. The 50% Fib retracement level of the major rally from the $8,218 low to $9,620 high is also near the $8,920 level.
Therefore, the $8,920 area is likely to act as a strong support zone in the coming sessions. On the upside, an initial resistance is near the $9,300 area and the 55 simple moving average (4-hours).
To move back into a positive zone, the price must settle above $9,300 and 55 simple moving average (4-hours). In the mentioned case, there are chances of a strong rise towards the $9,600 and $9,800 levels.
Looking at the chart, bitcoin price is clearly trading above a couple of important supports near the $9,100 levels. It could either rally again above the $9,300 barrier or extend its correction towards $8,920.
Technical indicators
4 hours MACD – The MACD is currently moving slowly in the bullish zone.
4 hours RSI (Relative Strength Index) – The RSI is currently rising towards the 50 level.
Key Support Levels – $9,100 and $8,920.
Key Resistance Levels – $9,300, $9,500 and $9,600.