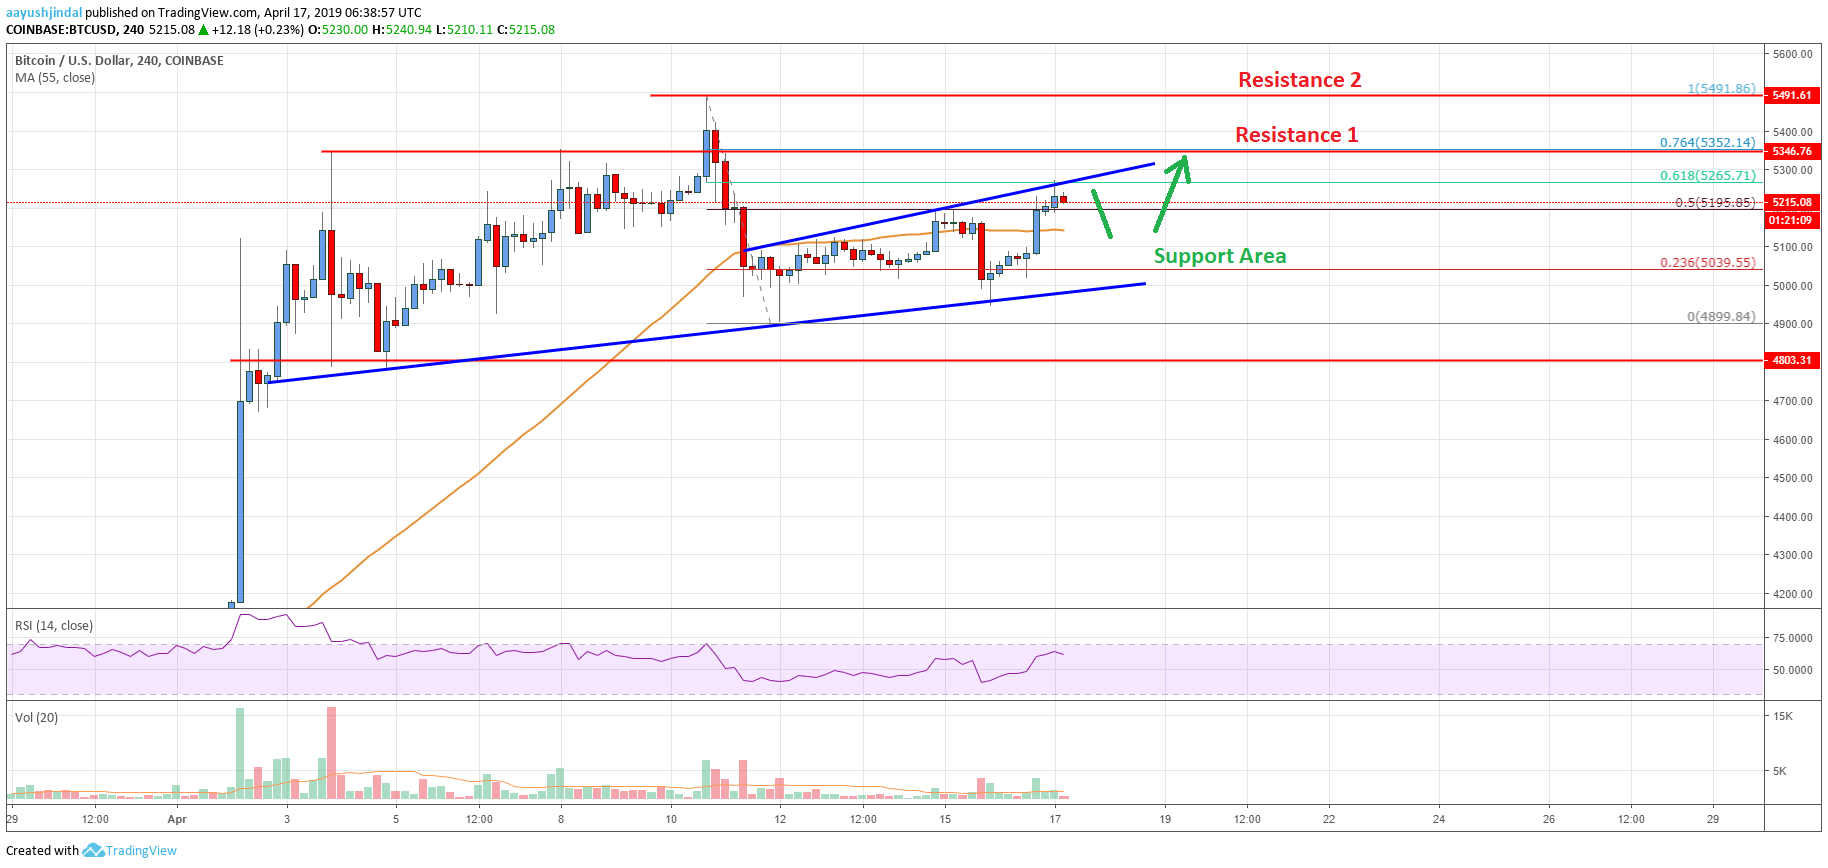
- Bitcoin price corrected lower recently and tested the $4,900 support area against the US Dollar.
- The price is currently recovering and it may continue to climb towards $5,340 and $5,500.
- There is a key bullish trend line in place with support at $5,000 on the 4-hours chart of the BTC/USD pair (data feed from Coinbase).
- The pair remains in a strong uptrend and it is likely to accelerate above the $5,350 resistance level.
Bitcoin price likely completed a downside correction near $4,900 against the US Dollar. BTC is currently moving higher and it may surge above the $5,340 and $5,450 resistance levels.
Bitcoin Price Analysis
This past week, there was a downside correction in bitcoin price below the $5,340 support against the US Dollar. The BTC/USD pair even broke the $5,200 support and the 55 simple moving average (4-hours). Finally, there was a break below the $5,000 level and the price traded as low as $4,899. Later, the price consolidated losses above $4,900 and recently climbed higher. It broke the $5,000 resistance and the 23.6% Fib retracement level of the last drop from the $5,491 high to $4,899 low.
More importantly, there was a break above the $5,100 level and the 55 simple moving average (4-hours). The price spiked above the $5,200 level and the 50% Fib retracement level of the last drop from the $5,491 high to $4,899 low. However, the upward move was capped by the $5,265 level and a connecting resistance trend line on the 4-hours chart of the BTC/USD pair. The pair also failed near the 61.8% Fib retracement level of the last drop from the $5,491 high to $4,899 low.
At the moment, the price is trading near the $5,200 level, with an initial support at $5,150. The main support is at $5,100 and the 55 simple moving average (4-hours). There is also a key bullish trend line in place with support at $5,000 on the same chart. Therefore, if there is a downside correction, the price is likely to find bids near $5,100 and $5,050. On the upside, a break above the $5,265 and $5,280 resistance may call for a fresh increase.

Looking at the chart, bitcoin price is likely to break the $5,280 resistance. The next key resistance is at $5,340, above which the price could rally towards the last swing high at $5,490. The overall trend is positive and the price may even break the $5,550 resistance in the coming days.
Technical indicators
4 hour MACD – The MACD is gaining pace in the bullish zone.
4 hour RSI (Relative Strength Index) – The RSI is currently well above the 50 level, with a bullish bias.
Key Support Levels – $5,100 and $5,050.
Key Resistance Levels – $5,280, $5,340 and $5,500.


