- Bitcoin price started a fresh increase above the $42,000 zone against the US Dollar.
- The price is now trading above $42,000 and the 55 simple moving average (4-hours).
- There was a break above a key contracting triangle with resistance near $42,500 on the 4-hours chart of the BTC/USD pair (data feed from Coinbase).
- The pair is now facing a major resistance near $45,000 and might correct lower.
Bitcoin price gained pace above $42,000 against the US Dollar. BTC even spiked above $44,000 and is currently consolidating gains.
Bitcoin Price Analysis
Bitcoin price started a fresh increase after it found support near the $41,500 zone. BTC formed a base and moved above the $42,000 resistance to start a steady recovery.
There was a clear move above the $42,500 resistance and the 55 simple moving average (4-hours). Besides, there was a break above a key contracting triangle with resistance near $42,500 on the 4-hours chart of the BTC/USD pair.
The pair even surged above the $44,000 resistance. The price climbed above the 61.8% Fib retracement level of the key decline from the $45,855 swing high to $41,570 low.
It is now consolidating near the $44,500 level. An immediate resistance is near the $44,500 level. It is near the 76.4% Fib retracement level of the key decline from the $45,855 swing high to $41,570 low. The next major resistance on the upside is near the $45,800 level.
To start another increase, the price must settle above the $45,800 level in the near term. If not, there might be a downside correction below $43,800. The next key support is near the $43,000 level.
If the price fails to stay above $43,000, it could extend losses in the near term. The next major support sits near $41,500, below which there is a risk of a move towards the $40,500 level. Any more losses might call for a test of the key $40,000 support zone.
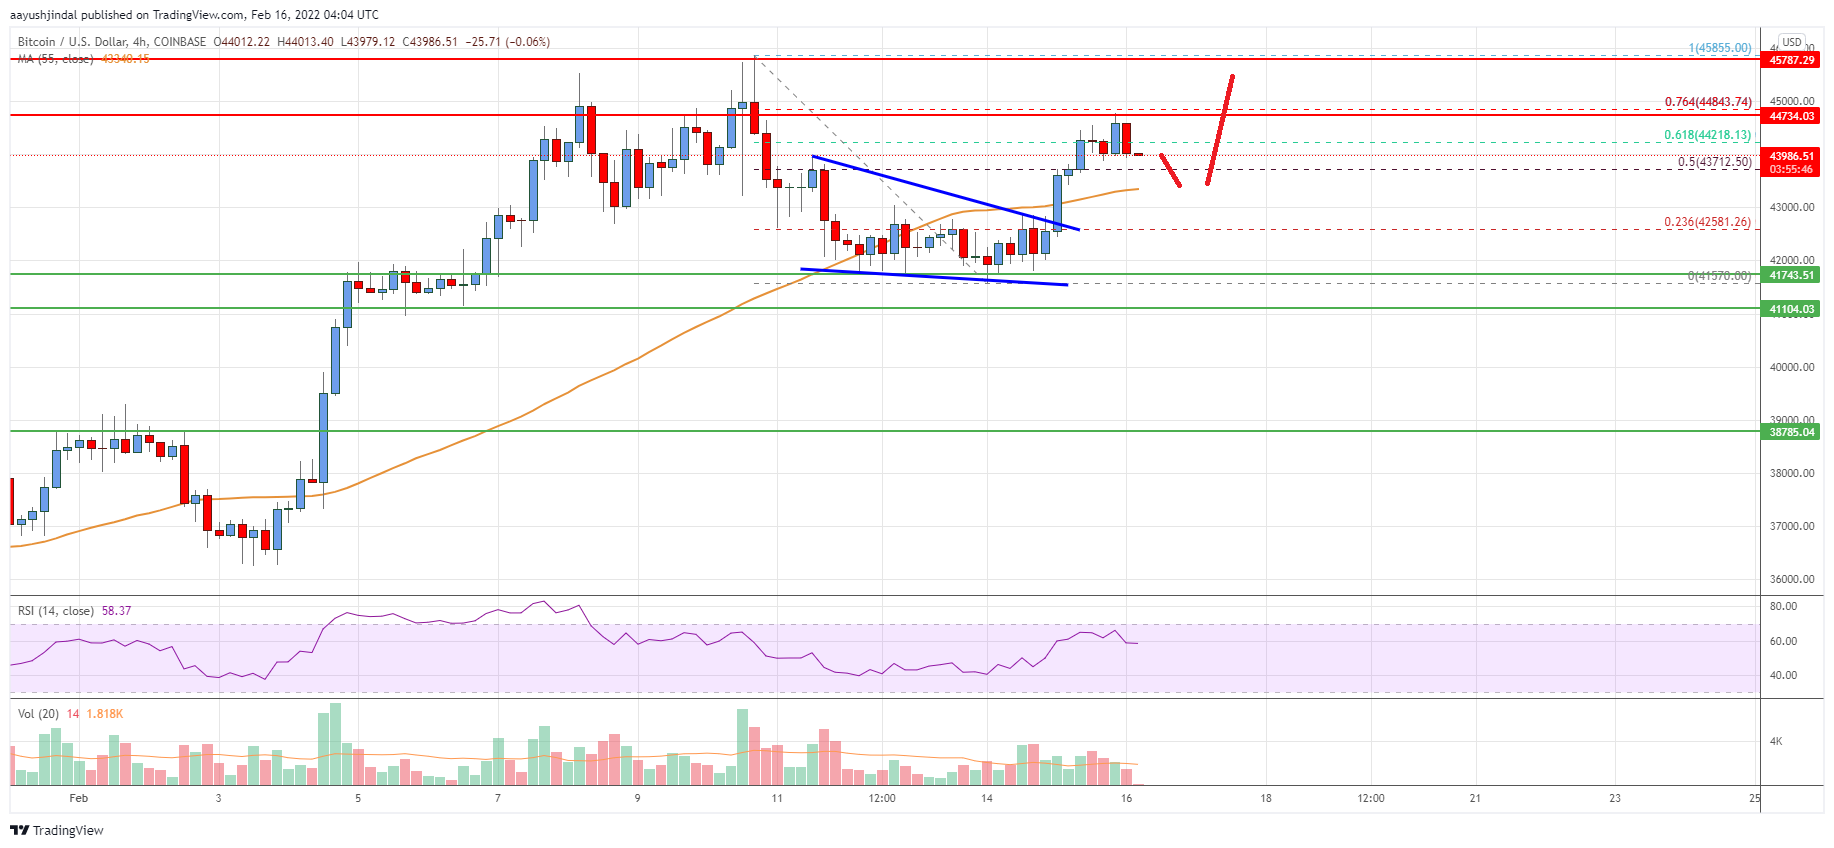
Looking at the chart, bitcoin price is clearly trading above $42,000 and the 55 simple moving average (4-hours). Overall, the price is now facing a major resistance near $45,000 and might correct lower.
Technical Indicators
4 hours MACD – The MACD is now losing momentum in the bullish zone.
4 hours RSI (Relative Strength Index) – The RSI is now above the 50 level.
Key Support Levels – $43,000 and $41,500.
Key Resistance Levels – $44,500, $44,800 and $45,800.