- Bitcoin price started a strong increase above the $17,000 and $18,000 resistance levels against the US Dollar.
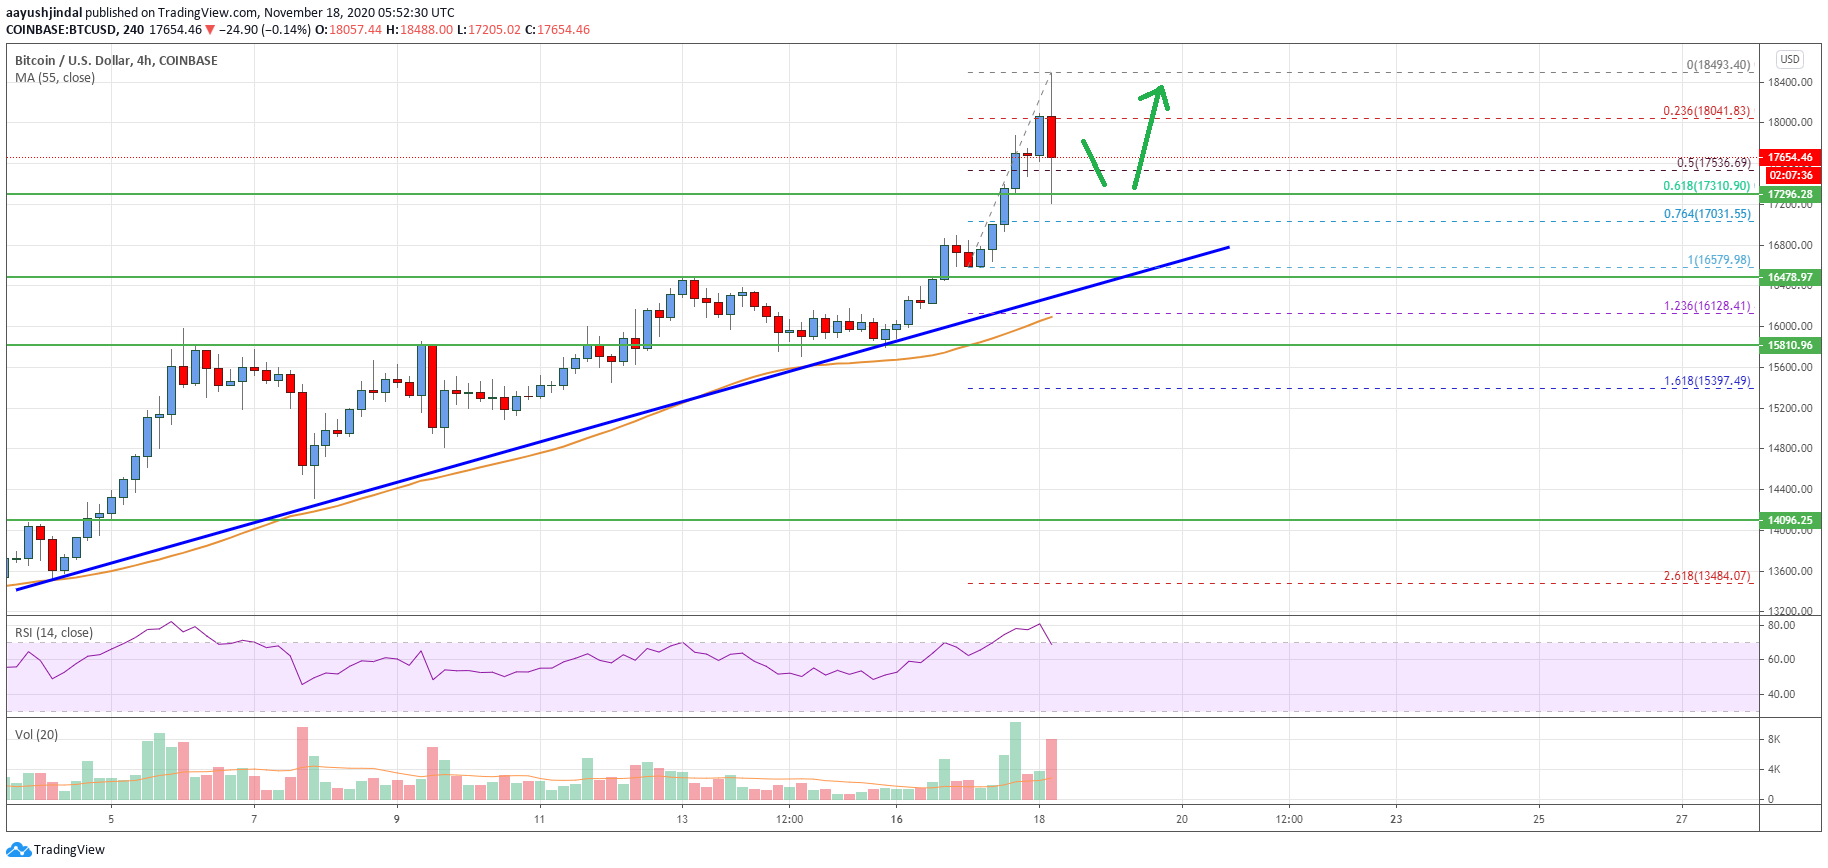
- The price traded as high as $18,493 and it settled nicely above the 55 SMA (H4).
- There is a key bullish trend line forming with support near $16,800 on the 4-hours chart of the BTC/USD pair (data feed from Coinbase).
- The pair could correct a few points, but the bulls are likely to remain active near $17,200 and $17,000.
Bitcoin price is showing bullish signs above the $17,000 zone against the US Dollar. BTC surged towards the $18,500 level and it is currently correcting lower.
Bitcoin Price Analysis
In the past few days, bitcoin price followed a bullish path above the $16,800 resistance against the US Dollar. BTC broke many hurdles near $17,000 to move further into a positive zone.
The price gained pace above the $17,500 and $18,000 levels. It traded close to the $18,500 resistance and settled well above the 55 simple moving average (4-hours). A new multi-month high was formed near $18,493 before it started a sharp downside correction.
The price traded below the $18,000 level. There was a break below the 50% Fib retracement level of the recent upward move from the $16,579 swing low to $18,493 high.
On the downside, the $17,200 level is a strong support. It is close to the 61.8% Fib retracement level of the recent upward move from the $16,579 swing low to $18,493 high. There is also a key bullish trend line forming with support near $16,800 on the 4-hours chart of the BTC/USD pair.
If there is a break below the trend line support, the price could extend its decline towards the $16,200 support. The 55 simple moving average (4-hours) is also near the $16,200 support.
On the upside, the $17,800 and $18,000 levels are initial hurdle. A successful close above the $17,800 and $18,000 levels may perhaps lead the price back towards the $18,500 level. Any further gains might call for a test of the $19,000 level.
Looking at the chart, bitcoin price is clearly trading in a bullish zone above the $17,200 support and the 55 SMA (H4). In the short-term, the price could correct a few points, but the bulls are likely to remain active near $17,200 and $17,000.
Technical indicators
4 hours MACD – The MACD is showing positive signs in the bullish zone.
4 hours RSI (Relative Strength Index) – The RSI is still well above the 50 level.
Key Support Levels – $17,200 and $17,000.
Key Resistance Levels – $17,800, $18,000 and $18,500.