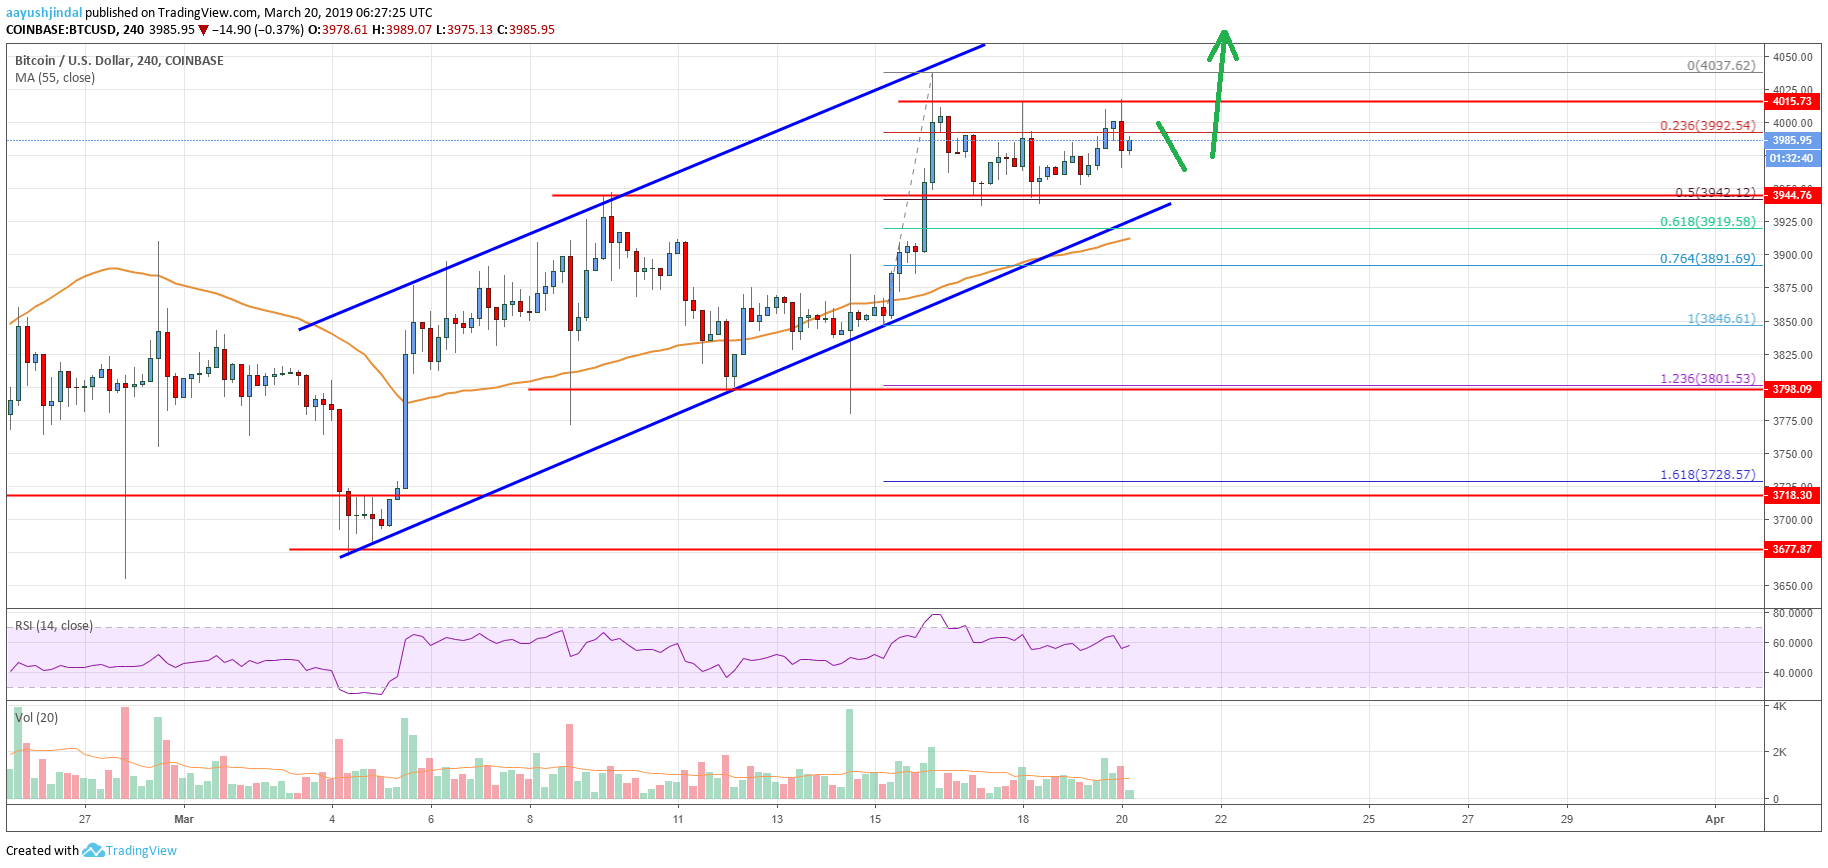
- Bitcoin price rallied recently above the $4,000 resistance and towards $4,040 against the US Dollar.
- The price traded as high as $4,037 and later started a downside correction.
- This past week’s highlighted major ascending channel is intact with support at $3,930 on the 4-hours chart of the BTC/USD pair (data feed from Coinbase).
- The pair remains supported on dips and it could extend gains above $4,035 and $4,080 in the near term.
Bitcoin price extended gains above $3,900 and $4,000 against the US Dollar. BTC is following a significant uptrend and it is likely to climb to a new monthly high above $4,035.
Bitcoin Price Analysis
In the last analysis, we discussed a strong uptrend above $3,750 in bitcoin price against the US Dollar. The BTC/USD pair remained in an uptrend and following a solid bullish pattern above the $3,900 resistance level. Buyers took control above $3,930 and the 55 simple moving average (4-hours). As a result, there were solid gains above the $3,950 and $3,980 resistance levels. The price even rallied above the $4,000 barrier and traded to a new monthly high near $4,037.
Later, the price started a downside correction below $4,400 and $3,980. There was a break below the 23.6% Fib retracement level of the last wave from the $3,846 low to $4,037 high. However, the decline was protected by the key $3,930 support level. Moreover, the 50% Fib retracement level of the last wave from the $3,846 low to $4,037 high also acted as a strong support for buyers. Finally, the price started trading in a range and traded higher towards the $4,000 and $4,015 resistance levels.
It seems like there is a solid barrier formed near the $4,015 level. A proper close above the mentioned $4,015 resistance level is likely to clear the path for more gains above the $4,035 and $4,050 levels. The next targets for buyers could be near $4,100 and $4,200. On the downside, the $3,930 level is a strong support. More importantly, this past week’s highlighted major ascending channel is intact with support at $3,930 on the 4-hours chart of the BTC/USD pair.

Looking at the chart, bitcoin price is clearly placed nicely above the $3,930 support. Therefore, there are high chances of more gains above the $4,015 and $4,050 levels. If not, a break below $3,930 could push the price towards the $3,860 support.
Technical indicators
4 hour MACD – The MACD is currently placed nicely in the bullish zone, with a positive bias.
4 hour RSI (Relative Strength Index) – The RSI is still trading well above the 50 level, with no major bearish sign.
Key Support Levels – $3,930 and 3,860.
Key Resistance Levels – $4,015, $4,050 and $4,100.


