- Bitcoin price is trading nicely above the $9,540 and $9,400 support levels against the US Dollar.
- It is currently struggling to clear the $9,940 and $10,020 resistance levels.
- There is a major bullish trend line forming with support at $9,600 on the 4-hours chart of the BTC/USD pair (data feed from Coinbase).
- The pair could start a strong rally if there is a clear break above $9,940 and $10,020.
Bitcoin price is currently consolidating gains above the $9,400 support against the US Dollar. BTC is likely to surge higher above the $10,000 barrier in the near term.
Bitcoin Price Analysis
In the past few days, bitcoin price started a steady rise above the $9,175 resistance against the US Dollar. BTC broke the main $9,400 resistance area to move further into a positive zone.
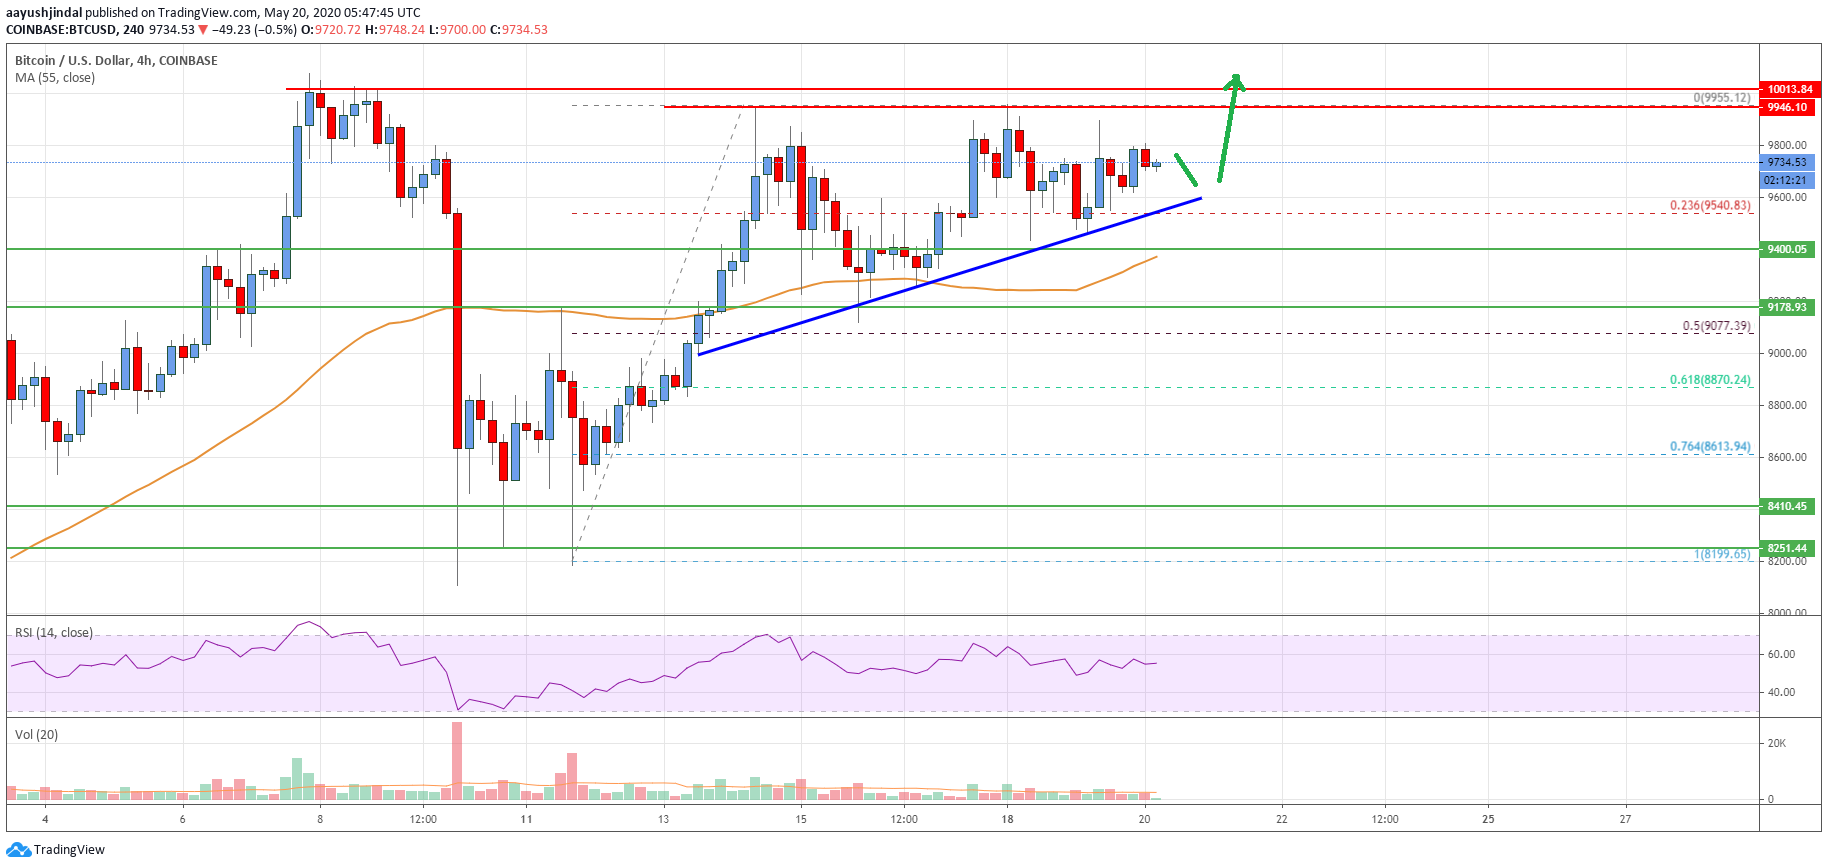
Besides, there was a break above the $9,540 resistance zone and the price settled nicely above the 55 simple moving average (4-hours). On the upside, the price is facing a strong resistance near the $9,940 and $10,020 levels.
The recent high was near the $9,955 level before the price started consolidating gains. It corrected a few points below the $9,700 level. There was a break below the 23.6% Fib retracement level of the upward move from the $8,199 swing low to $9,955 high.
The price found support near the $9,400 area and the 55 simple moving average (4-hours). It also stayed well above the 50% Fib retracement level of the upward move from the $8,199 swing low to $9,955 high.
More importantly, there is a major bullish trend line forming with support at $9,600 on the 4-hours chart of the BTC/USD pair. The trend line is acting as a strong support and the price is currently rising towards the $9,800 level.
The main hurdle is still near the $9,940 and $10,020 resistance levels, above which bitcoin price is likely to continue higher. The next major resistance could be near the $10,400 and $10,500 levels.
Conversely, the price could break the trend line support to start a fresh decline towards the $9,175 support. Any further losses may perhaps trigger a sustained downward move towards the $8,500 level.
Looking at the chart, bitcoin price is clearly trading above the main $9,400 and $9,175 support levels. As long as there is no close below $9,400, the price is likely to break the $10,000 barrier.
Technical indicators
4 hours MACD – The MACD is slowly gaining pace in the bullish zone.
4 hours RSI (Relative Strength Index) – The RSI is currently well above the 50 level.
Key Support Levels – $9,400 and $9,175.
Key Resistance Levels – $9,800, $9,940 and $10,020.