- Bitcoin price remained in a strong uptrend above $28,000 and $30,000 against the US Dollar.
- The price is now trading well above $34,000 and the 55 simple moving average (4-hours).
- There is a crucial bullish trend line forming with support near $31,300 on the 4-hours chart of the BTC/USD pair (data feed from Coinbase).
- The pair is likely to continue higher if it clears the $35,500 and $38,800 resistance levels.
Bitcoin price is currently gaining momentum above $34,000 against the US Dollar. BTC could rally further above $35,500 as long as it is above $30,000.
Bitcoin Price Analysis
After a downside correction, bitcoin price formed a support base above $28,000 and $30,000 against the US Dollar. BTC started a fresh increase above the $32,000 level and it rallied above the $33,500 level.
As a result, there was a strong push above the $34,000 level. The price even broke the $35,000 resistance level and settled well above the 55 simple moving average (4-hours). A new all-time high is formed near $35,913 and the price is currently consolidating gains.
An initial support on the downside is near the $34,500 level. It is close to the 23.6% Fib retracement level of the recent upward move from the $29,909 swing low to $35,909 high.
Any more losses could lead the price towards the $33,000 support level. It is close to the 50% Fib retracement level of the recent upward move from the $29,909 swing low to $35,909 high. There is also a crucial bullish trend line forming with support near $31,300 on the 4-hours chart of the BTC/USD pair.
If there is a downside break towards the trend line support and $31,000, the bulls are likely to remain active. On the upside, the price is facing hurdles near the $35,500 and $35,800 levels.
A successful break above the $35,500 level and a follow up move above the recent high could pump the price another all-time high above the $36,000 level.
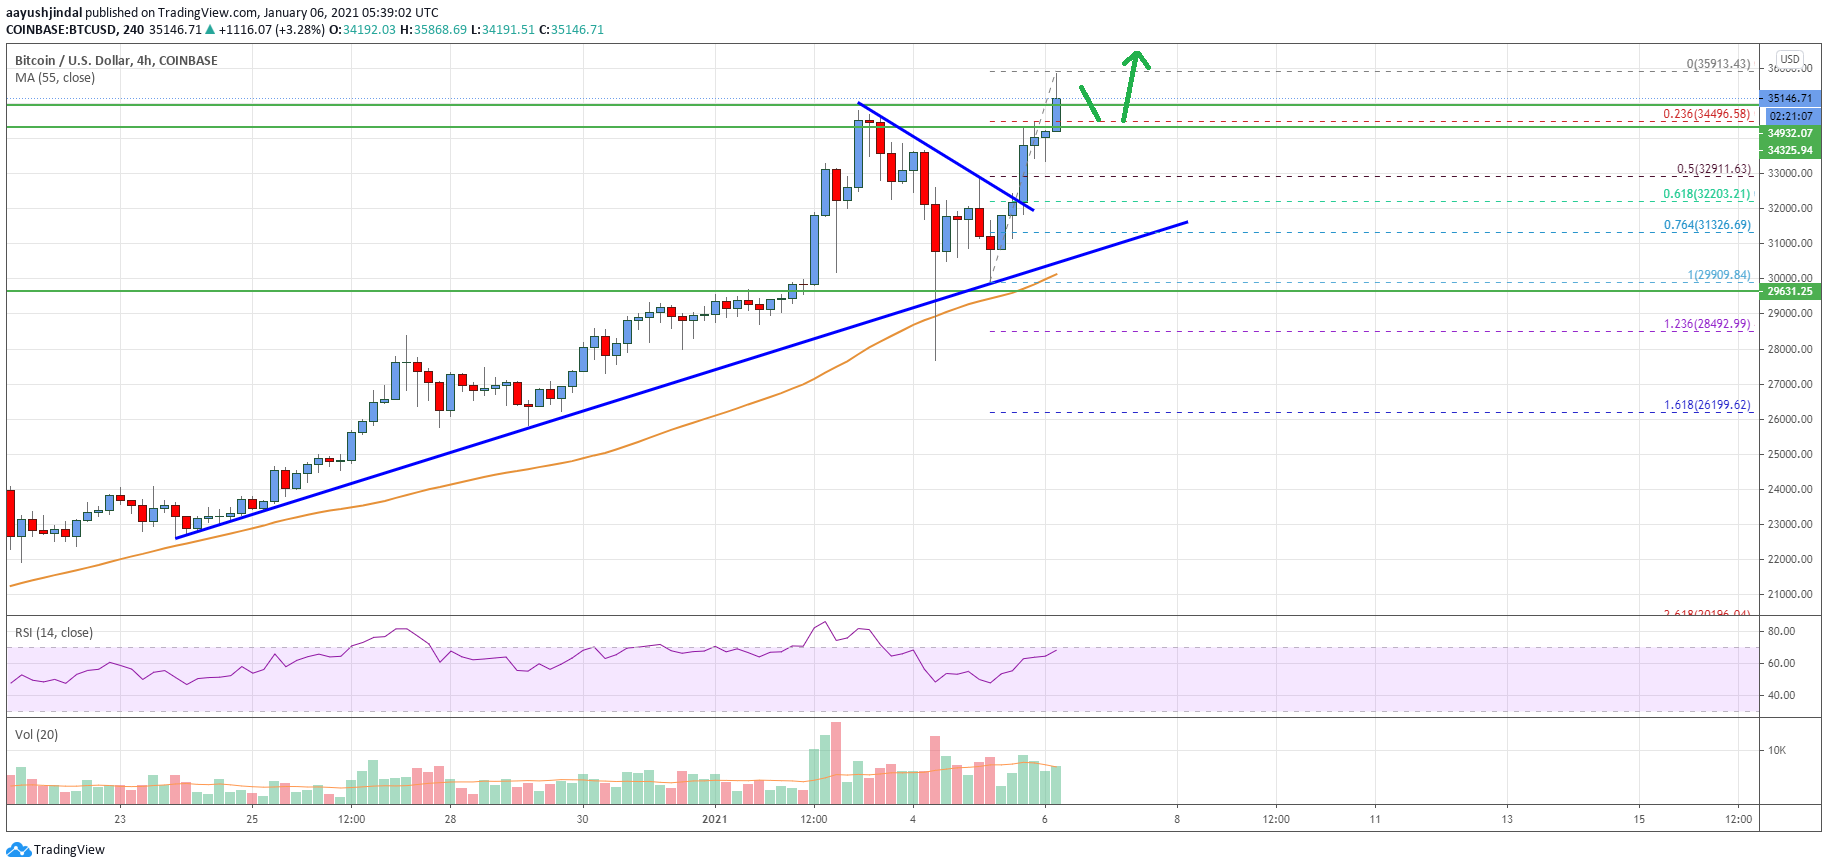
Looking at the chart, bitcoin price is clearly trading nicely above $34,000 and the 55 simple moving average (4-hours). Overall, the price is likely to continue higher if it clears the $35,500 and $38,800 resistance levels.
Technical indicators
4 hours MACD – The MACD is showing positive signs in the bullish zone.
4 hours RSI (Relative Strength Index) – The RSI is still well above the 50 level.
Key Support Levels – $34,500 and $32,000.
Key Resistance Levels – $35,500, $35,800 and $37,200.