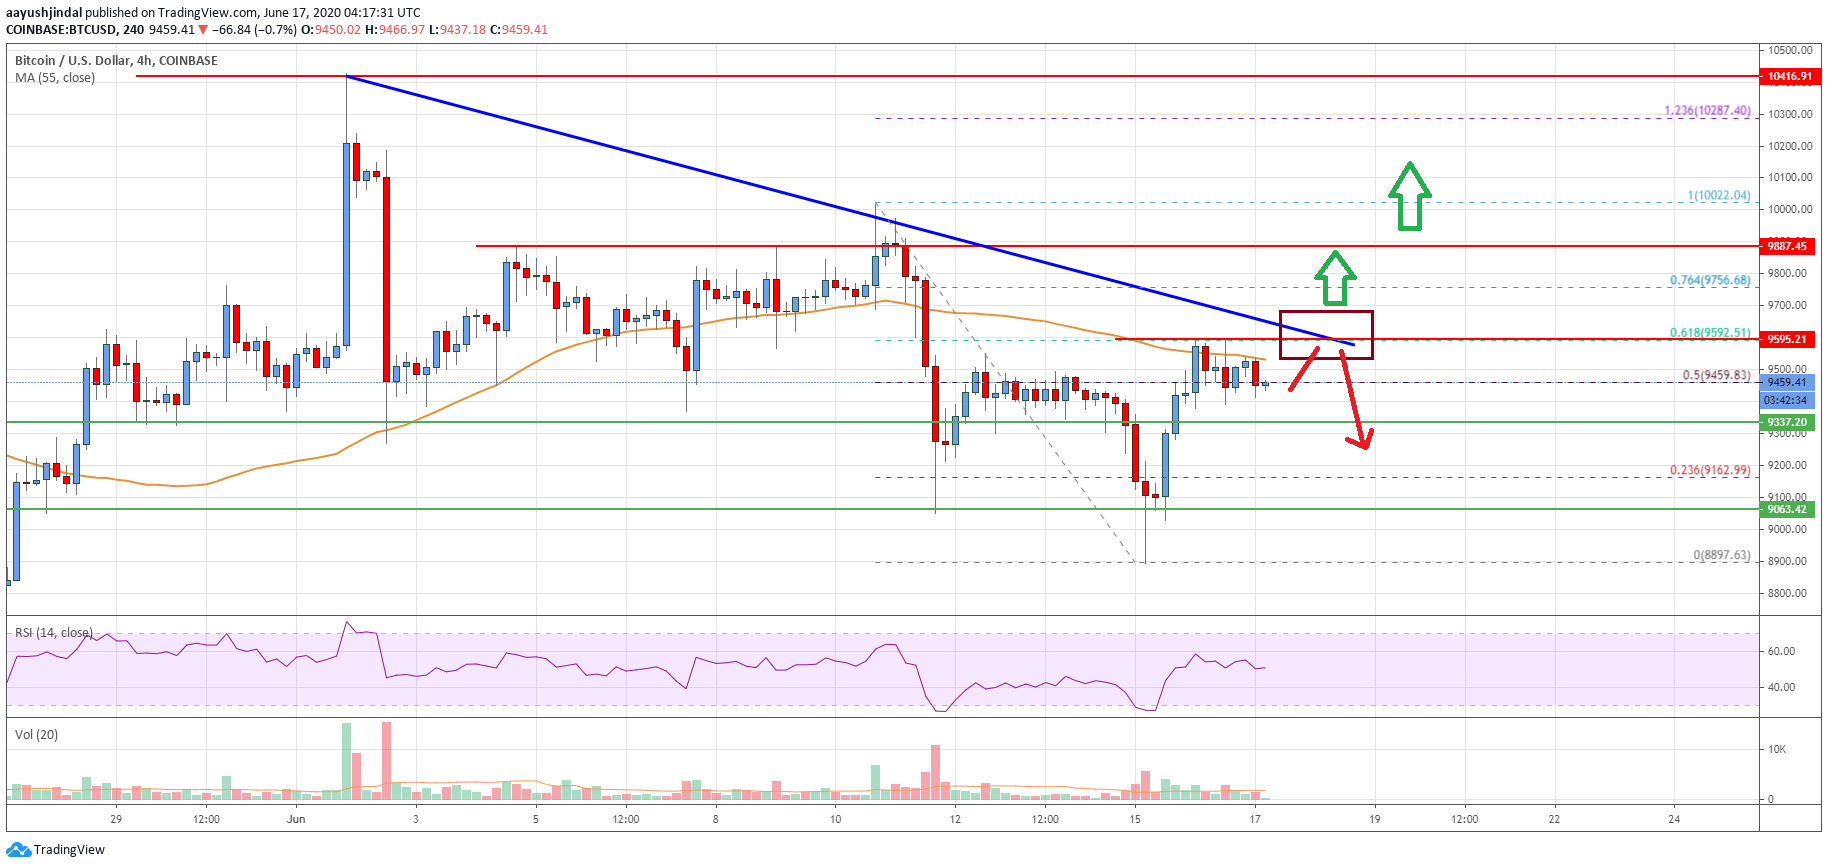
- Bitcoin price declined sharply below the $9,330 and $9,060 support levels against the US Dollar.
- It traded as low as $8,897 and it is currently correcting higher above $9,330.
- There is a major bearish trend line forming with resistance near $9,600 on the 4-hours chart of the BTC/USD pair (data feed from Coinbase).
- The pair could either rally above the $9,600 resistance or start a fresh decline below $9,330.
Bitcoin price is currently recovering higher above $9,330 and $9,450 against the US Dollar. However, BTC must break the $9,600 resistance level to start a fresh rally in the near term.
Bitcoin Price Analysis
After facing hurdles near the $10,000 level, bitcoin price started a fresh decline against the US Dollar. BTC broke the key $9,330 support level and the 55 simple moving average (4-hours) to start the decline.
It broke many supports and even dived below the $9,060 pivot level. Finally, it found support near the $8,900 level and a low is formed near $8,897. The price started a strong recovery wave from the $8,897 low and climbed back above the $9,330 resistance zone.
The upward move was such that the price even broke the 50% Fib retracement level of the main decline from the $10,022 high to $8,897 low. However, the price is now facing a major resistance near the $9,580 and $9,600 levels.
It seems like there 61.8% Fib retracement level of the main decline from the $10,022 high to $8,897 low is acting as a strong resistance. There is also a major bearish trend line forming with resistance near $9,600 on the 4-hours chart of the BTC/USD pair.
An immediate resistance is near the $9,520 level and the 55 simple moving average (4-hours). Therefore, the price is clearly facing a lot of hurdles near the $9,600 level. A successful break and close above the $9,600 level could start a strong increase in the coming sessions.
Conversely, there is a risk of a bearish reaction below the $9,400 and $9,300 support levels. If there is a close below $9,300, the price may perhaps test the $9,060 support or the $9,000 handle.

Looking at the chart, bitcoin price is clearly facing a huge hurdle near $9,600. It could either rally above the $9,600 resistance or start a fresh decline below $9,330.
Technical indicators
4 hours MACD – The MACD is now losing pace in the bullish zone.
4 hours RSI (Relative Strength Index) – The RSI is currently just above the 50 level.
Key Support Levels – $9,330 and $9,060.
Key Resistance Levels – $9,580, $9,600 and $9,880.


