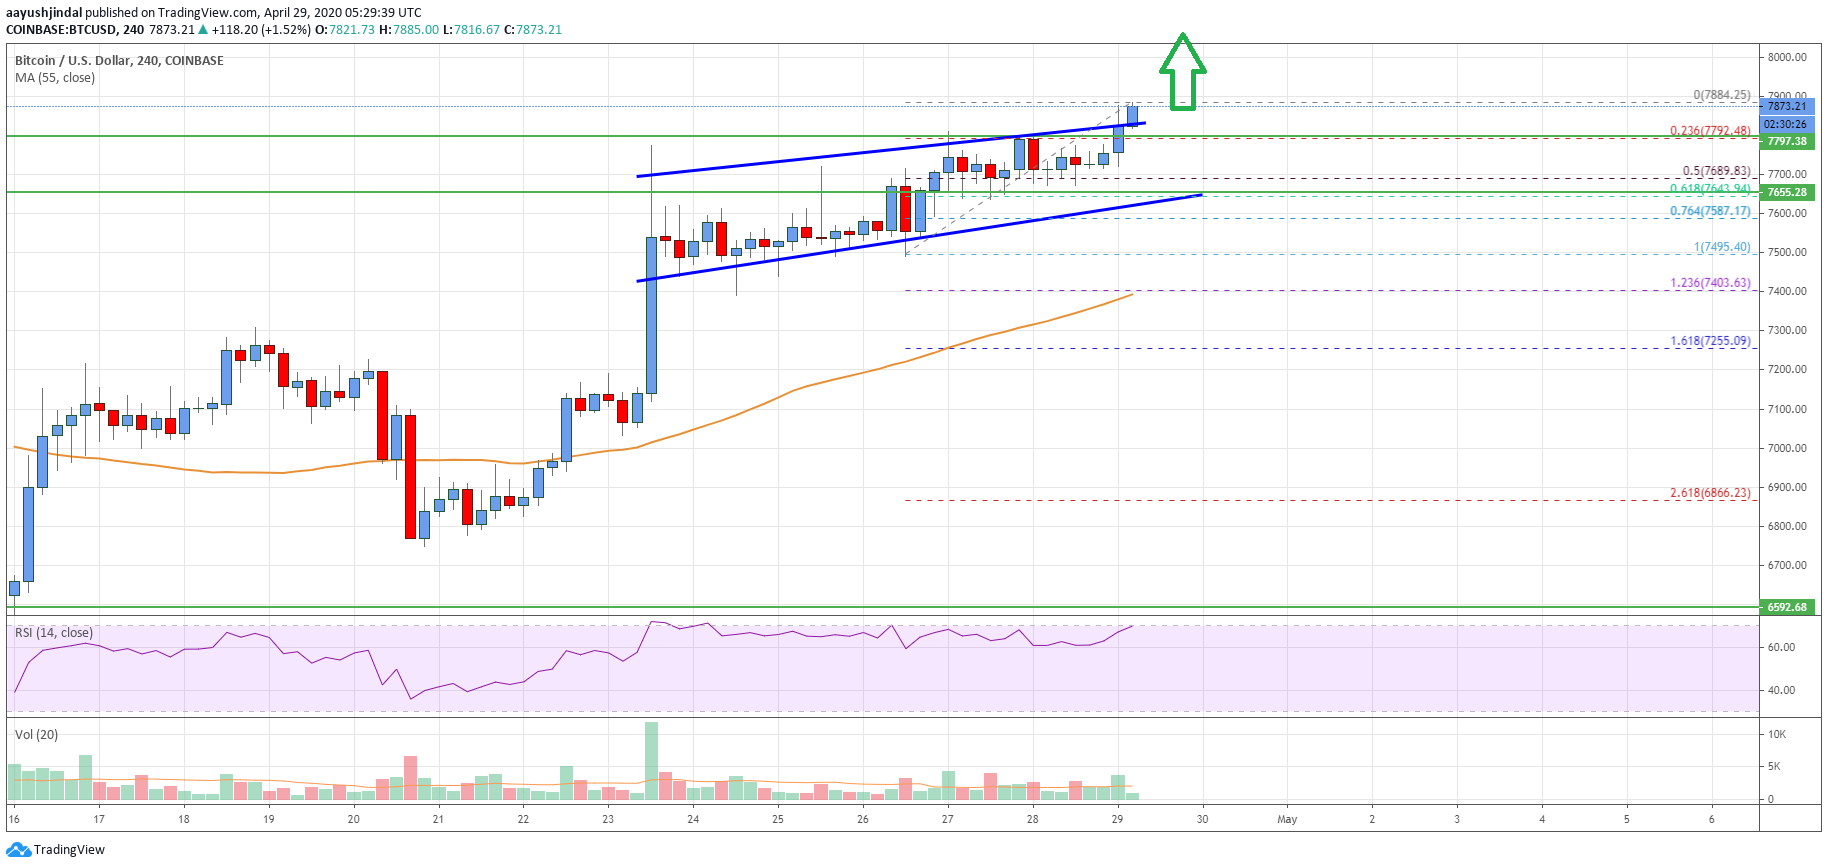
- Bitcoin price started a fresh increase and traded above the $7,655 resistance against the US Dollar.
- It is currently preparing for a sharp rally above the $8,000 resistance area.
- There was a break above a key ascending channel with resistance near $7,820 on the 4-hours chart of the BTC/USD pair (data feed from Coinbase).
- The pair could correct in the short term, but it is likely to find support near $7,655.
Bitcoin price is gaining bullish momentum above $7,655 and $7,700 against the US Dollar. BTC is likely to accelerate higher once it clears the $8,000 resistance.
Bitcoin Price Analysis
In the past few days, bitcoin price followed a steady uptrend and climbed above the $7,400 pivot zone against the US Dollar. BTC even broke the key $7,500 resistance level to move further into a positive zone.
Moreover, there was a close above the $7,655 resistance and the 55 simple moving average (4-hours). It opened the doors for more gains above the $7,600 and $7,700 levels.
Recently, there was a break above a key ascending channel with resistance near $7,820 on the 4-hours chart of the BTC/USD pair. The pair is now trading above the $7,800 resistance and it looks set for a larger rally.
An initial resistance is near the $8,000 level, above which bitcoin price is likely to rally significantly. In the mentioned case, the price could test the $8,400 and $8,500 resistance levels. Any further gains may perhaps call for a test of $8,800.
On the downside, an initial support is near the broken contracting triangle at $7,800. It is also close to the 23.6% Fib retracement level of the recent rise from the $7,495 swing low to $7,884 high.
The first major support is near the $7,680 level or the 50% Fib retracement level of the recent rise from the $7,495 swing low to $7,884 high.
The main support is near the $7,655 level, below which there is a risk of a substantial decline. The next major support below $7,655 is seen near the $7,400 level or the 55 simple moving average (4-hours).

Looking at the chart, bitcoin price is clearly showing a lot of bullish signs above the $7,655 and $7,800 levels. Therefore, there are high chances of a strong rise above the $8,000 level unless it dives below $7,655.
Technical indicators
4 hours MACD – The MACD is now gaining pace in the bullish zone.
4 hours RSI (Relative Strength Index) – The RSI is currently well above the 60 level.
Key Support Levels – $7,655 and $7,400.
Key Resistance Levels – $8,000, $8,400 and $8,500.


