- Bitcoin price started declining after it failed to surpass the $7,380 resistance area against the US Dollar.
- The price is now trading well below the $7,300 pivot level and the 55 simple moving average (4-hours).
- There was a break below a connecting bullish trend line with support near $7,220 on the 4-hours chart of the BTC/USD pair (data feed from Coinbase).
- The pair could dive below the $7,060 support in the near term before a decent upward move.
Bitcoin price is slowly moving lower towards the $7,060 support against the US Dollar. BTC remains at a risk of a downside thrust below $7,000 before it climbs higher.
Bitcoin Price Analysis
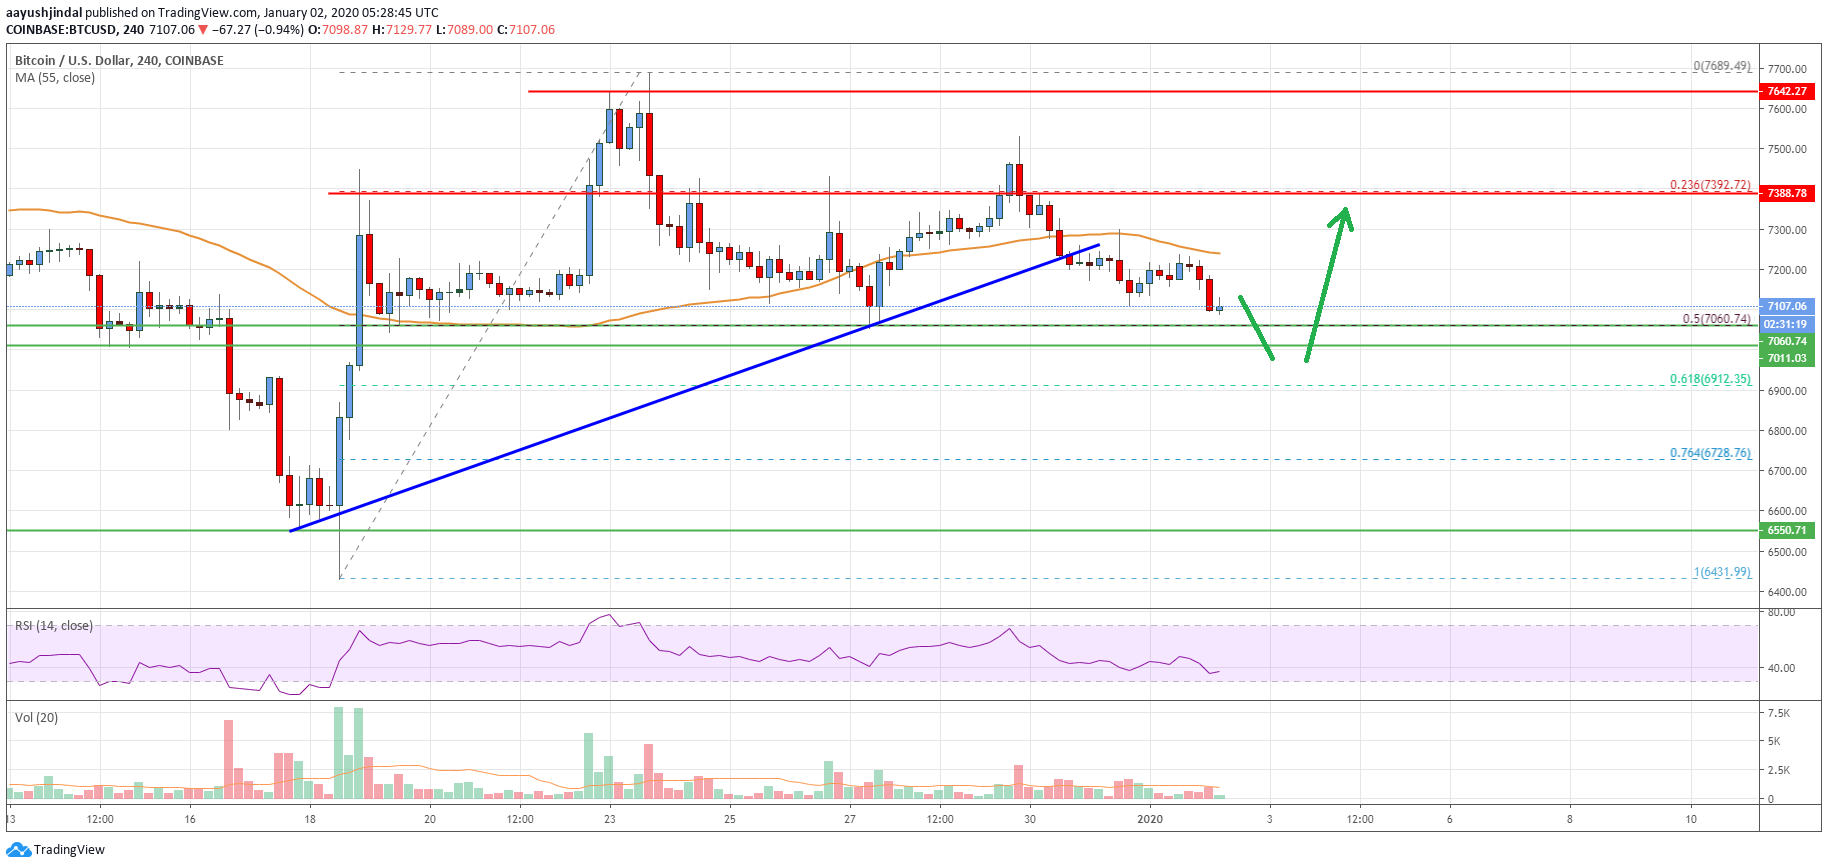
In the past few days, there were bearish moves in bitcoin price below the $7,500 resistance area against the US Dollar. Moreover, BTC settled below the $7,380 pivot level and the 55 simple moving average (4-hours).
It opened the doors for more downsides below the 23.6% Fib retracement level of the upward move from the $6,431 low to $7,689 high. Besides, there was a break below a connecting bullish trend line with support near $7,220 on the 4-hours chart of the BTC/USD pair.
The pair is now trading well below the $7,200 support area. An immediate support is near the $7,060 level. It coincides with the 50% Fib retracement level of the upward move from the $6,431 low to $7,689 high.
Additionally, the $7,010 level is also a strong support (the previous breakout resistance). At the moment, bitcoin price is sliding and it seems like there could be a downside spike below the $7,060 and $7,010 support levels.
In the mentioned case, the price might find support near the 61.8% Fib retracement level of the upward move from the $6,431 low to $7,689 high. Once the current decline is complete near $7,010 or $6,910, the price could bounce back.
On the upside, the first key resistance is near the $7,220 level and the 55 simple moving average (4-hours). The next major resistance is near the $7,380 and $7,400 levels.
Therefore, a successful close above the $7,220 and $7,400 levels is needed for a fresh upward move in the coming days.
Looking at the chart, bitcoin price is showing a few bearish signs below $7,200 and $7,220. Having said that, the bulls are likely to put a strong fight near $7,010 or $6,910.
Technical indicators
4 hour MACD – The MACD is currently gaining momentum in the bearish zone.
4 hour RSI (Relative Strength Index) – The RSI is currently recovering from the 30 level.
Key Support Levels – $7,010 and $6,910.
Key Resistance Levels – $7,220, $7,380 and $7,400.