- Bitcoin price rallied recently and even climbed above the $10,000 resistance against the US Dollar.
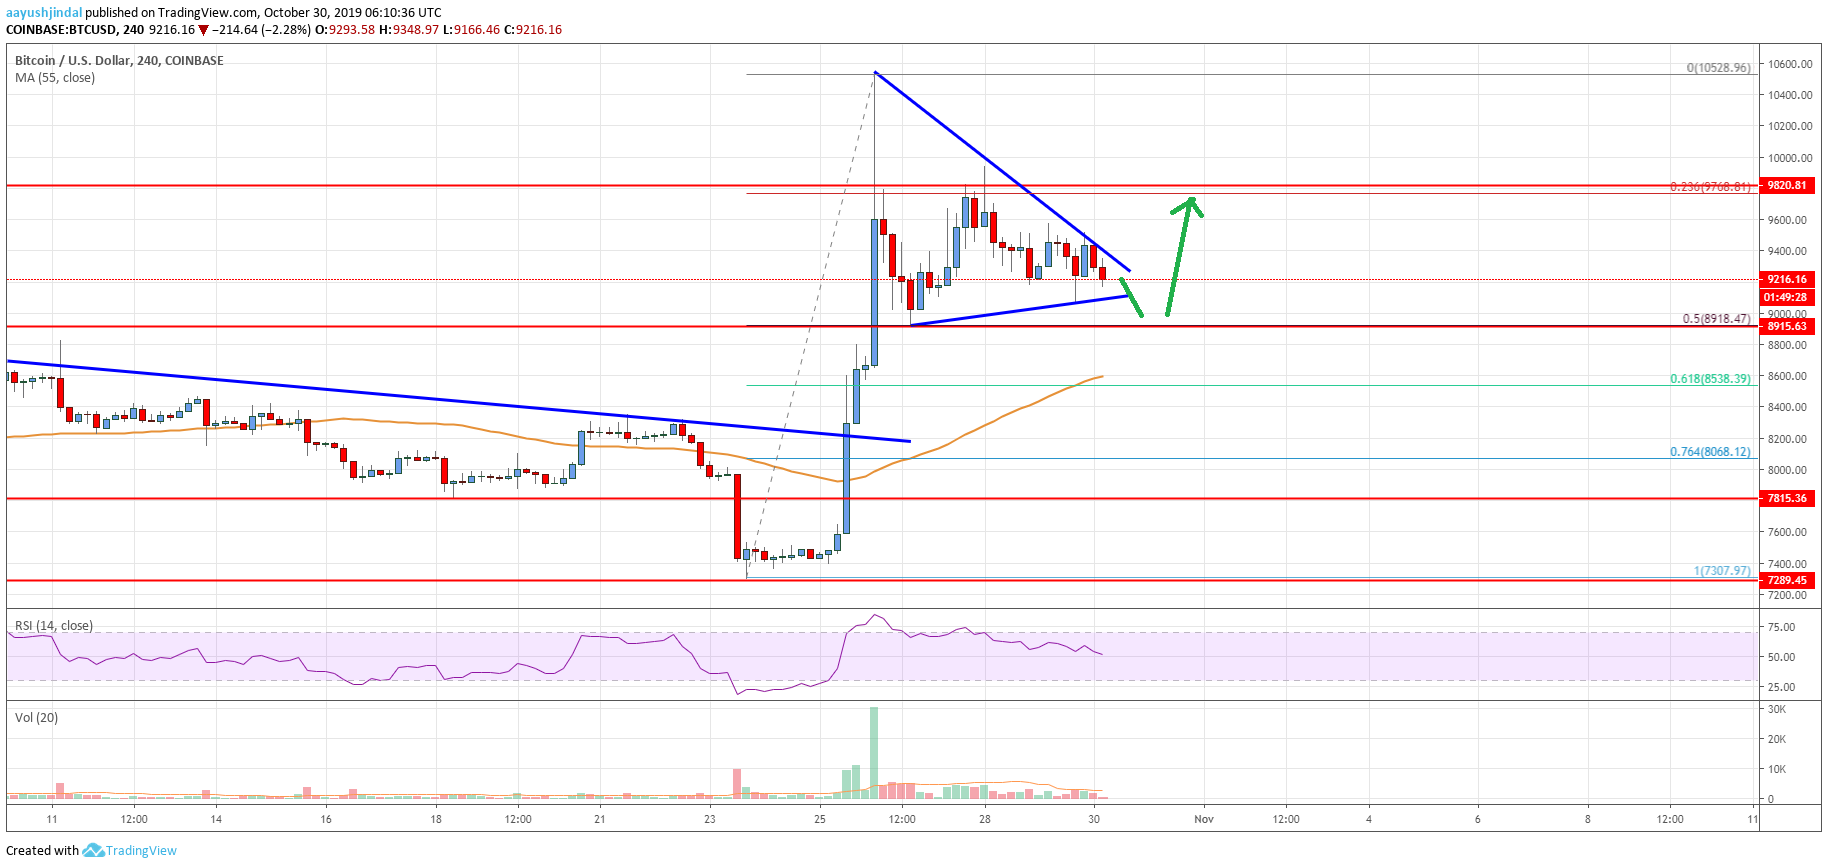
- The price is currently correcting lower and is trading below the $9,820 pivot level.
- There is a major contracting triangle forming with resistance near $9,400 on the 4-hours chart of the BTC/USD pair (data feed from Coinbase).
- The pair could correct further, but it is likely to remain well supported above $8,900 and $8,500.
Bitcoin price is correcting gains below $9,800 against the US Dollar. BTC might test $8,900 or even $8,500 before it starts a fresh increase in the coming days.
Bitcoin Price Analysis
This past week, bitcoin price started a strong rally from well below the $8,200 resistance against the US Dollar. BTC rallied above the $8,500 and $9,000 resistance levels. Moreover, there was a close above $9,000 and the 55 simple moving average (4-hours).
Finally, the price climbed above the $10,000 resistance area, but it failed to retain bullish momentum. A swing high was formed near $10,528 and recently the price started a fresh downside correction.
There was a break below the $9,820 pivot level and the $9,750 support. Besides, the price declined below the 23.6% Fib retracement level of the upward move from the $7,307 low to $10,528 high.
However, the $8,900 and $9,000 levels seem to be acting as strong supports. The 50% Fib retracement level of the upward move from the $7,307 low to $10,528 high is also near the $8,915 level to provide support to the bulls.
At the outset, there is a major contracting triangle forming with resistance near $9,400 on the 4-hours chart of the BTC/USD pair. If there is an upside break above the $9,400 resistance, the price could resume its upward move.
An immediate resistance is near the $9,820 pivot level, above which bitcoin price could continue to rise towards the $10,000 and $10,500 levels. Any further gains may perhaps lead the price towards the $11,200 level.
On the other hand, there could be a downside break below the $9,150 support. The next major support is near the $8,900 level, below which the price could dive towards the $8,500 support or the 55 simple moving average (4-hours).
Looking at the chart, bitcoin price seems to be consolidating gains and correcting below $9,500. There could be an extended decline below $9,000, but as long as it is above $8,500, there are chances of another rally.
Technical indicators
4 hour MACD – The MACD is showing positive signs in the bullish zone.
4 hour RSI (Relative Strength Index) – The RSI is currently correcting lower and it is approaching the 50 level.
Key Support Levels – $8,900 and $8,500.
Key Resistance Levels – $9,400, $9,820 and $10,000.