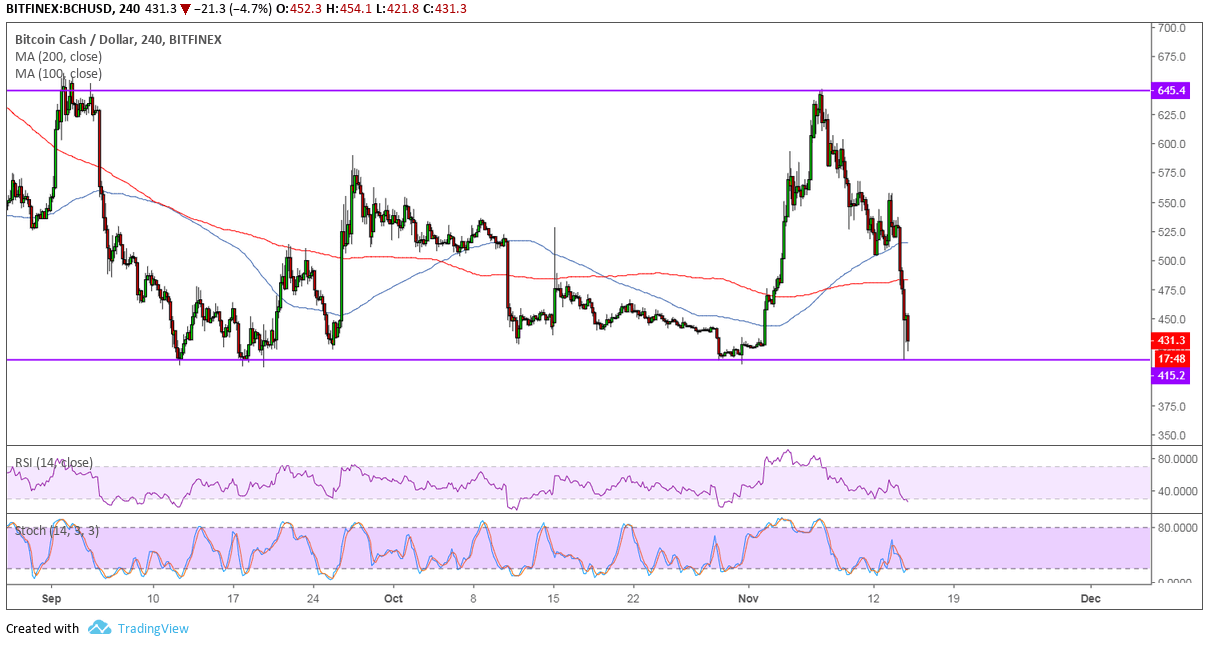
Bitcoin Cash is down to the bottom of its range seen on the 4-hour chart, testing a major support zone ahead of its hard fork. If the floor holds, a bounce to the range top around $645 could take place while a breakdown could spur a slide that’s the same height as the range.
This spans a little over $200 so a breakdown could take Bitcoin Cash to the $250 levels. However, the 100 SMA is above the longer-term 200 SMA to indicate that the path of least resistance is to the upside. In other words, support is more likely to hold than to break. Then again, the moving averages are simply oscillating to reflect sideways action.
RSI has room to head lower, though, which means that there’s some selling momentum left. The oscillator is nearing oversold levels to signal potential selling exhaustion at some point and turning higher could signal a return in bullish momentum. Stochastic already seems to be turning higher to indicate that buyers might be ready to regain control.

The uncertainty related to this Bitcoin Cash hard fork is being blamed for the massive declines in cryptocurrency markets over the past 24 hours. The community still hasn’t reached a consensus on which version to support after the split, and investors were likely reminded that issues like these could possibly come up for other altcoins at some point.
Forecasts after the split range widely from as low as $250 to as high as $800, depending on how things go and if any major complications arise. The digital asset is expected to split to Bitcoin ABC or Bitcoin SV and the “hash wars” continue to heat up. Coinbase has halted Bitcoin Cash trading leading up to this hard fork, also likely contributing the drop as it may have encouraged traders to liquidate their holdings ahead of time.
Images courtesy of TradingView


