- Bitcoin cash price rallied this week and gained more than 100% against the US Dollar.
- The price climbed above the $300 and tested the $350 area before correcting lower.
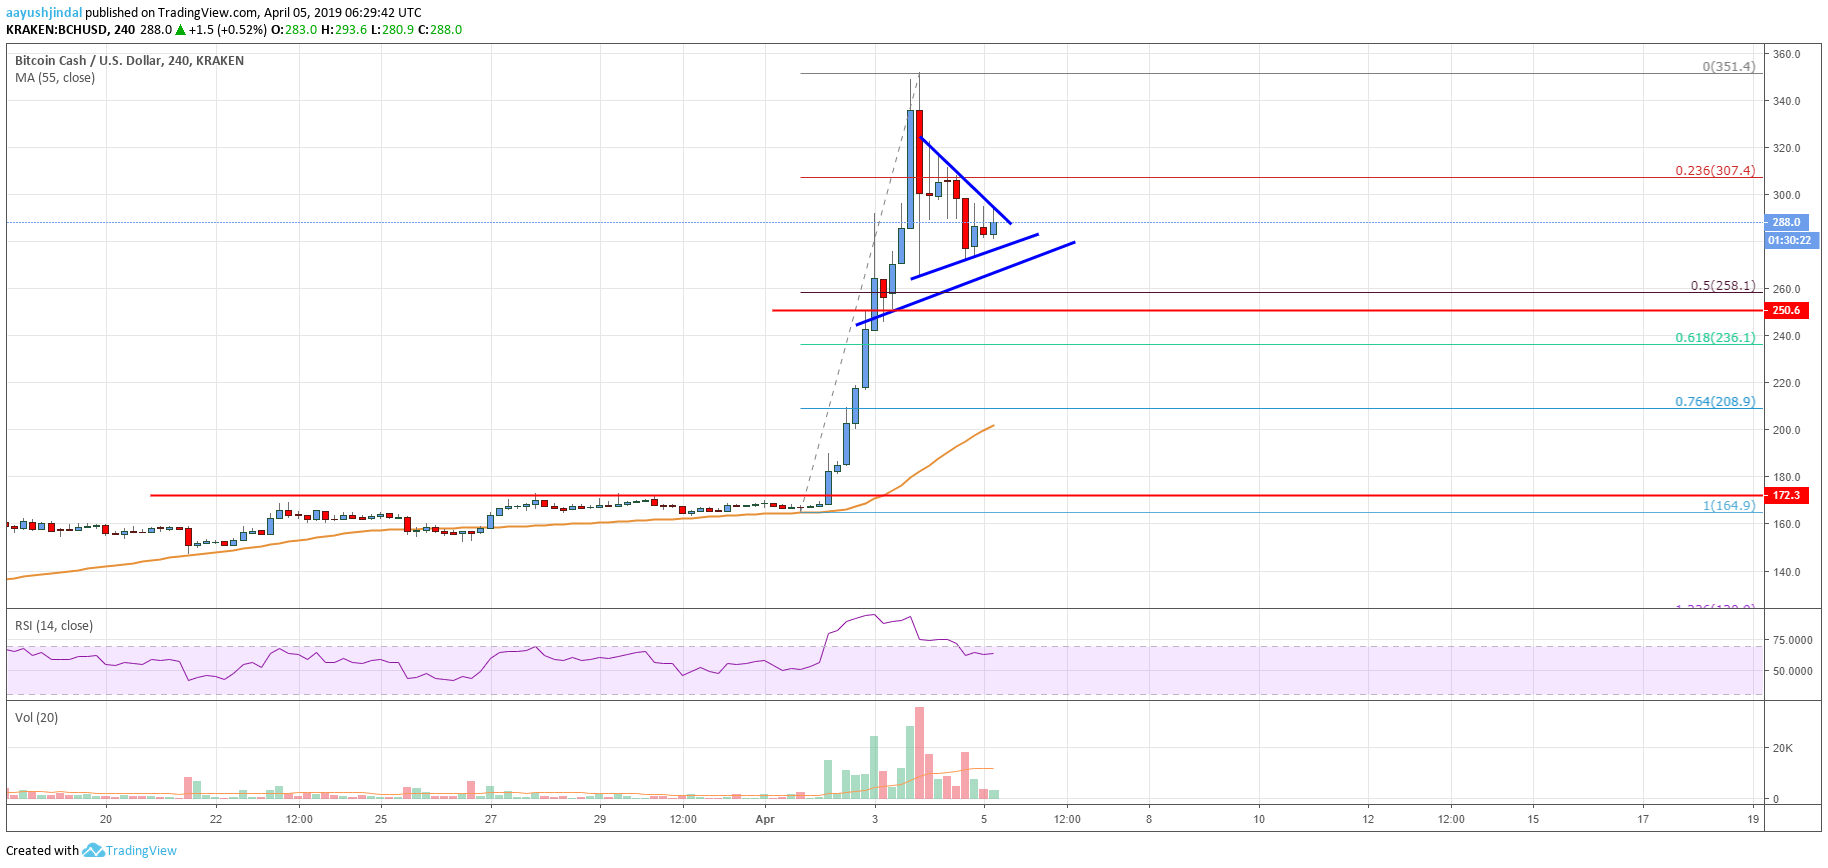
- There is a major contracting triangle forming with support near $275 on the 4-hours chart of the BCH/USD pair (data feed from Kraken).
- The pair is likely to surge higher again if it breaks the $300 pivot level in the short term.
Bitcoin cash price climbed higher significantly above $250 and $300 against the US Dollar. BCH tested the $350 level, corrected lower, and now preparing for the next break.
Bitcoin Cash Price Analysis
This week, there was a strong increase in bitcoin, ripple, Ethereum, and bitcoin cash against the US Dollar. Earlier, the BCH/USD pair formed a support base above the $140 and $150 levels. It traded in a range below the $170 level for a few sessions. Finally, buyers got into action and pushed the price above the $170 and $200 resistance levels. It resulted in a sharp upward move above the $250 and $300 resistance levels. The recent trend was such that the price even climbed above $325 and settled well above the 55 simple moving average (4-hours).
It tested the $350 resistance and formed a high near $351. Recently, it corrected lower sharply below the $325 and $300 levels. There was a break below the 23.6% Fib retracement level of the last wave from the $164 swing low to $351 high. However, the price found a strong support near the $265-270 area. At the moment, there is a major contracting triangle forming with support near $275 on the 4-hours chart of the BCH/USD pair.
If there is an upside break above the triangle and $300, the price might resume its upward move. The next immediate resistance is at $330, above which the price could revisit the $350 level. On the other hand, if there is a break below the $275 support area, the price might correct towards $260. Besides, the 50% Fib retracement level of the last wave from the $164 swing low to $351 high is near $258 to act as strong support.

Looking at the chart, bitcoin cash price clearly rallied significantly before correcting from the $350 resistance. Going forward, the price is likely to bounce back above $300 and $330. Conversely, a break below the $258 support might negate the current bullish structure in the near term.
Technical indicators
4 hours MACD – The MACD for BCH/USD is likely to gain traction in the bullish zone.
4 hours RSI (Relative Strength Index) – The RSI for BCH/USD corrected lower, but it remains well above 50.
Key Support Levels – $175 and $158.
Key Resistance Levels – $300 and $330.


