Key Points
- Bitcoin cash price tumbled heavily below the $150 and $100 support levels against the US Dollar.
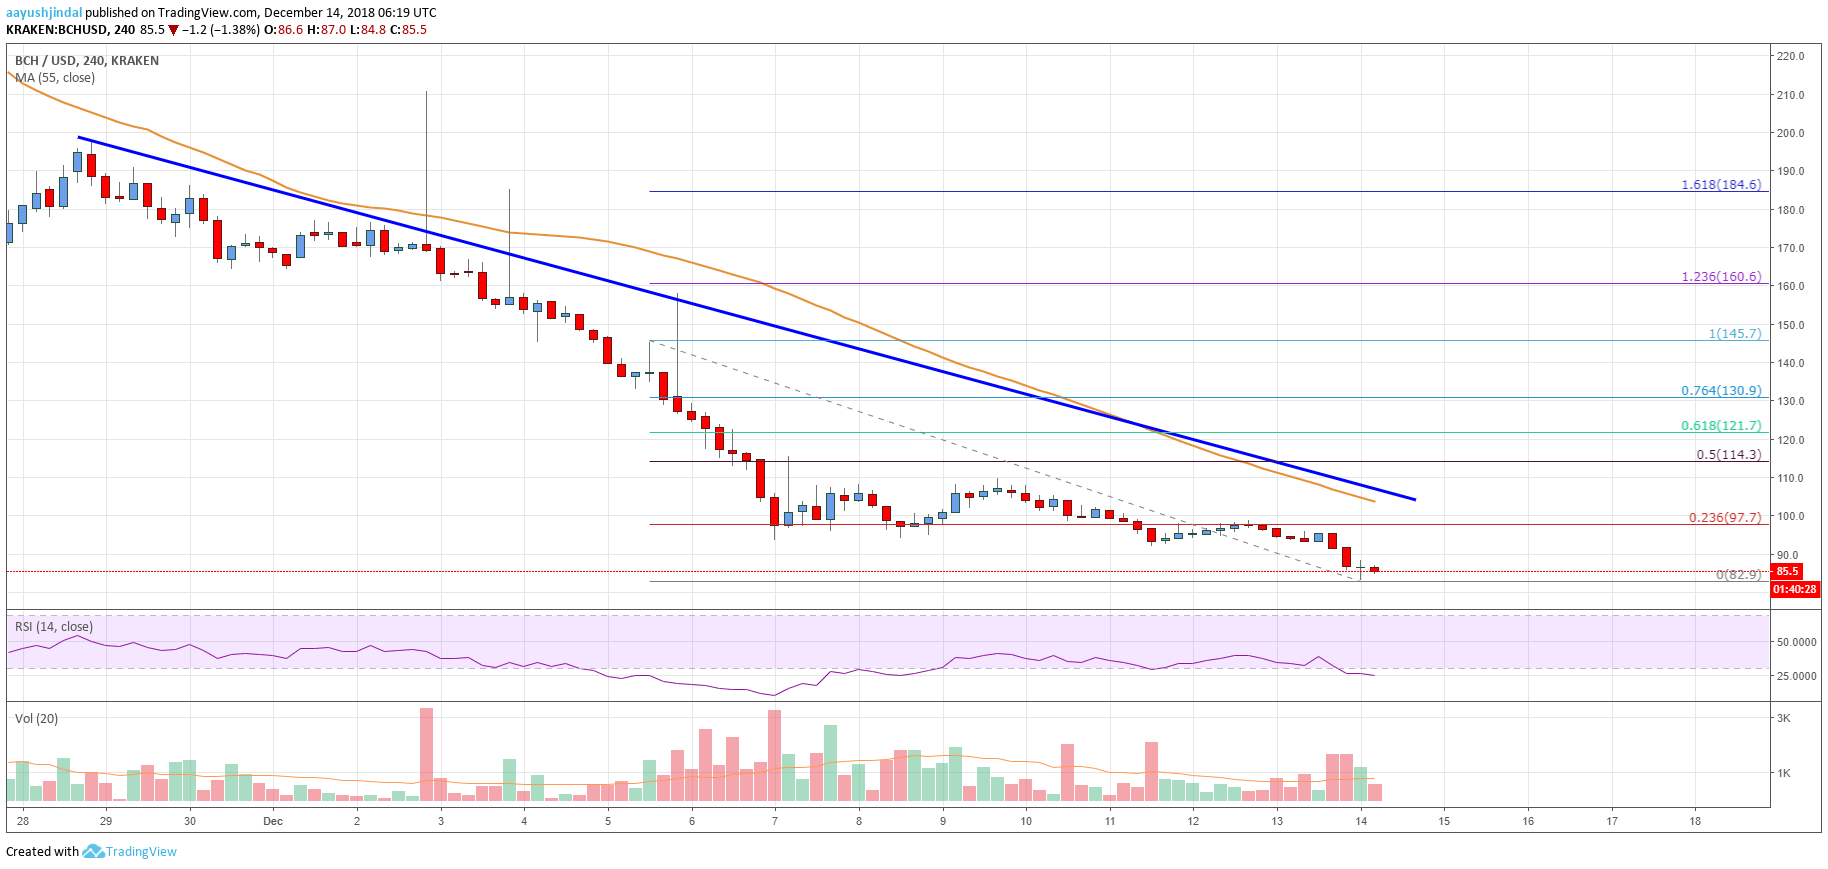
- There is a significant bearish trend line formed with resistance at $110 on the 4-hours chart of the BCH/USD pair (data feed from Kraken).
- The pair seems to be struggling below $100 and it could decline further below $80 and $75.
Bitcoin cash price settled below the key $100 support against the US Dollar. BCH may slide further towards $75 if bitcoin breaks the $3,200 support.
Bitcoin Cash Price Analysis
The past few weeks were pretty bearish for bitcoin cash price below the $150 support against the US Dollar. The BCH/USD pair tumbled and broke the $125, $110 and $100 support levels. There was a close below the $100 pivot and the 55 simple moving average (4-hours). A new multi month low was formed at $82 and it seems like the current decline is not over yet.
Recently bitcoin, Ethereum, ripple, litecoin and eos also faced a sharp increase in selling pressure. However, BCH was one of the worst performers as it settled below $100. An initial resistance is near the $95 level. Above $95, the 23.6% Fib retracement level of the last drop from the $145 high to $82 low is at $97. More importantly, there is a significant bearish trend line formed with resistance at $110 on the 4-hours chart of the BCH/USD pair. A successful close above the trend line and $100 could push the price towards the $115 resistance. It is the 50% Fib retracement level of the last drop from the $145 high to $82 low.

Looking at the chart, bitcoin cash price remains in a significant downtrend below $100 and $110. If sellers remain in action, there could be a sharp drop below $82, $80 and even $75.
Looking at the technical indicators:
4-hours MACD – The MACD for BCH/USD is gaining momentum in the bearish zone.
4-hours RSI (Relative Strength Index) – The RSI for BCH/USD is currently well below the 30 level.
Key Support Level – $80
Key Resistance Level – $100


