- Bitcoin cash price rallied towards the $450 level and recently corrected sharply against the US Dollar.
- The price broke many supports such as $420 and $400, and it tested the $340 support area.
- There is a major bullish trend line forming with support near $338 on the 4-hours chart of the BCH/USD pair (data feed from Kraken).
- The pair remains well supported above the $330 and $340 levels, and it could soon bounce back.
Bitcoin cash price touched the key $450 resistance level and recently declined heavily against the US Dollar. BCH tested the $340 support level and it could rebound after a short term consolidation.
Bitcoin Cash Price Analysis
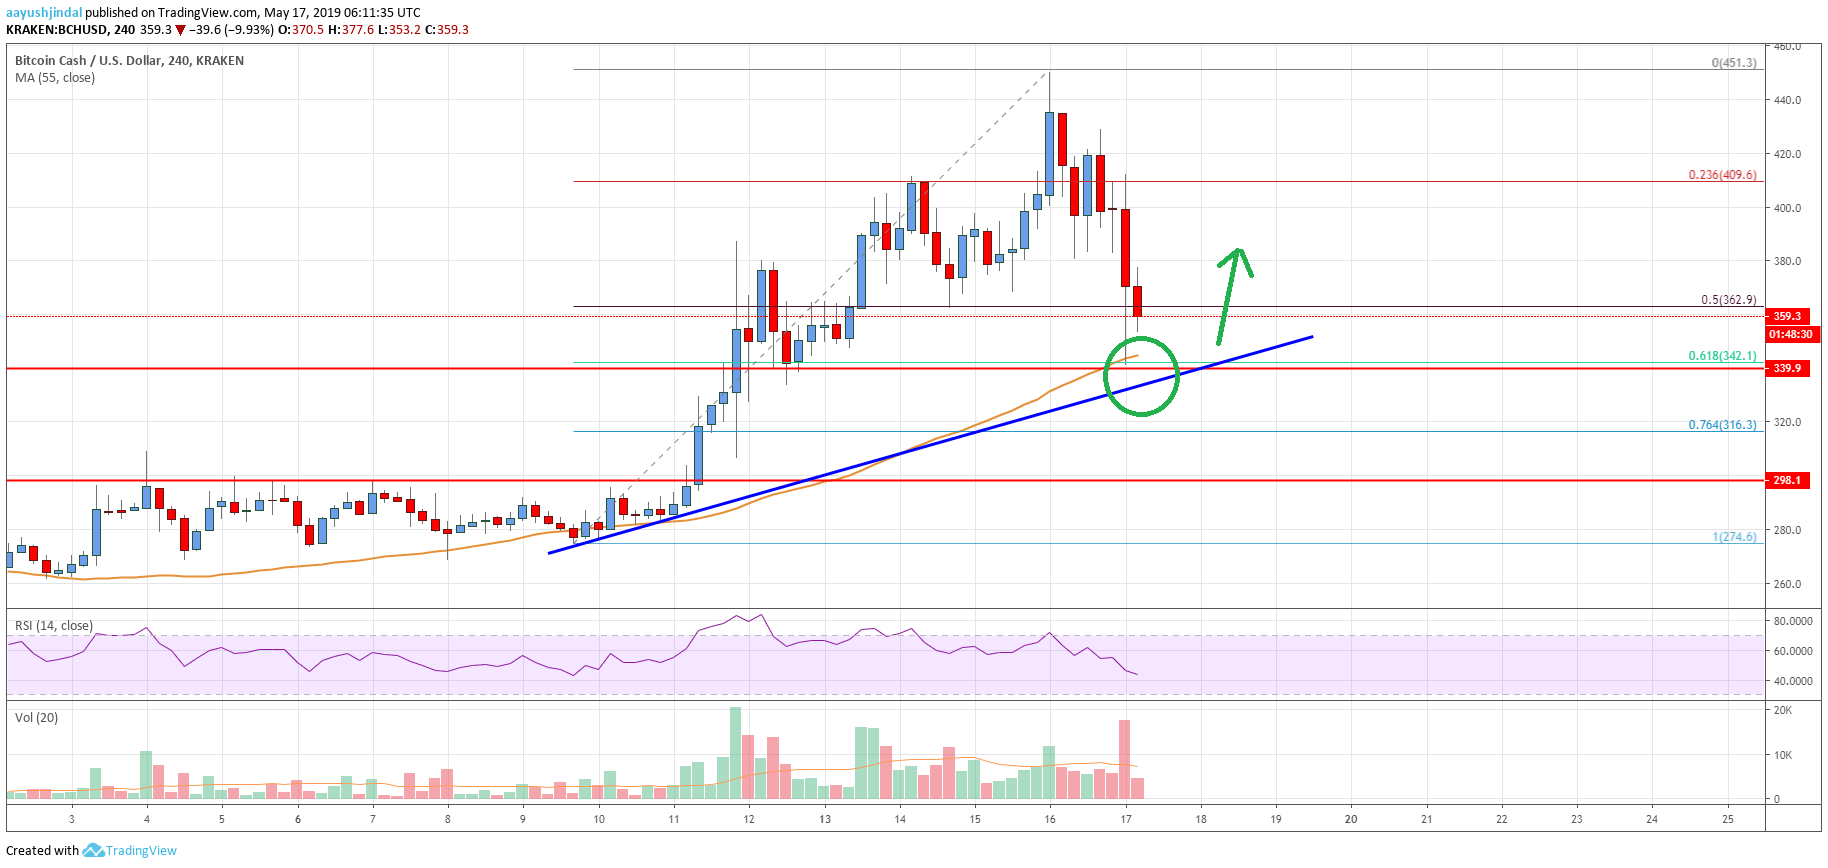
This week, there was a significant rise in bitcoin cash price above the $380 and $400 levels against the US Dollar. The BCH/USD pair even broke the $425 resistance level and the 55 simple moving average (4-hours). It traded close to the $450 level and formed a new 2019 high at $451. Recently, it started a sharp downside correction below the $425 and $410 support levels. The decline was such that the price even traded below the $400 and $382 support levels.
It declined below $362 and the 50% Fib retracement level of the last wave from the $274 swing low to $451 high. However, the $340 support and the 55 simple moving average (4-hours) acted as a strong buy zone. Moreover, the price tested the 61.8% Fib retracement level of the last wave from the $274 swing low to $451 high. There is also a major bullish trend line forming with support near $338 on the 4-hours chart of the BCH/USD pair. Clearly, there is strong support formed near the $338 and $340 levels. Therefore, the price could bounce back above $360 in the near term.
The next key resistance is at $388, above which the price may climb back above $400. Conversely, if there is a downside break below $338 and close below the 55 simple moving average (4-hours), the price could decline further. The next important support for the bulls is near the $300 level (the previous breakout zone).

Looking at the chart, bitcoin cash price declined heavily after trading towards the $450 resistance. However, the $340 support area holds the key. There are high chances of a fresh increase above $388 and $400 as long as there is no close below $338.
Technical indicators
4 hours MACD – The MACD for BCH/USD is gaining momentum in the bearish zone.
4 hours RSI (Relative Strength Index) – The RSI for BCH/USD declined steadily below the 50 level and is moving towards 40.
Key Support Levels – $338 and $300.
Key Resistance Levels – $388 and $400.


