- Bitcoin cash price rallied recently and broke the $125 and $130 resistance levels against the US Dollar.
- The price traded as high as $131 and later started a downside correction.
- There is a crucial bullish trend line formed with support at $116 on the 4-hours chart of the BCH/USD pair (data feed from Kraken).
- The pair is likely to start a fresh rally if buyers succeed in gaining strength above $122 and $124.
Bitcoin cash price is placed nicely above the $118 and $116 supports against the US Dollar. BCH could resume its uptrend if it clears the $122 and $124 resistances in the near term.
Bitcoin Cash Price Analysis
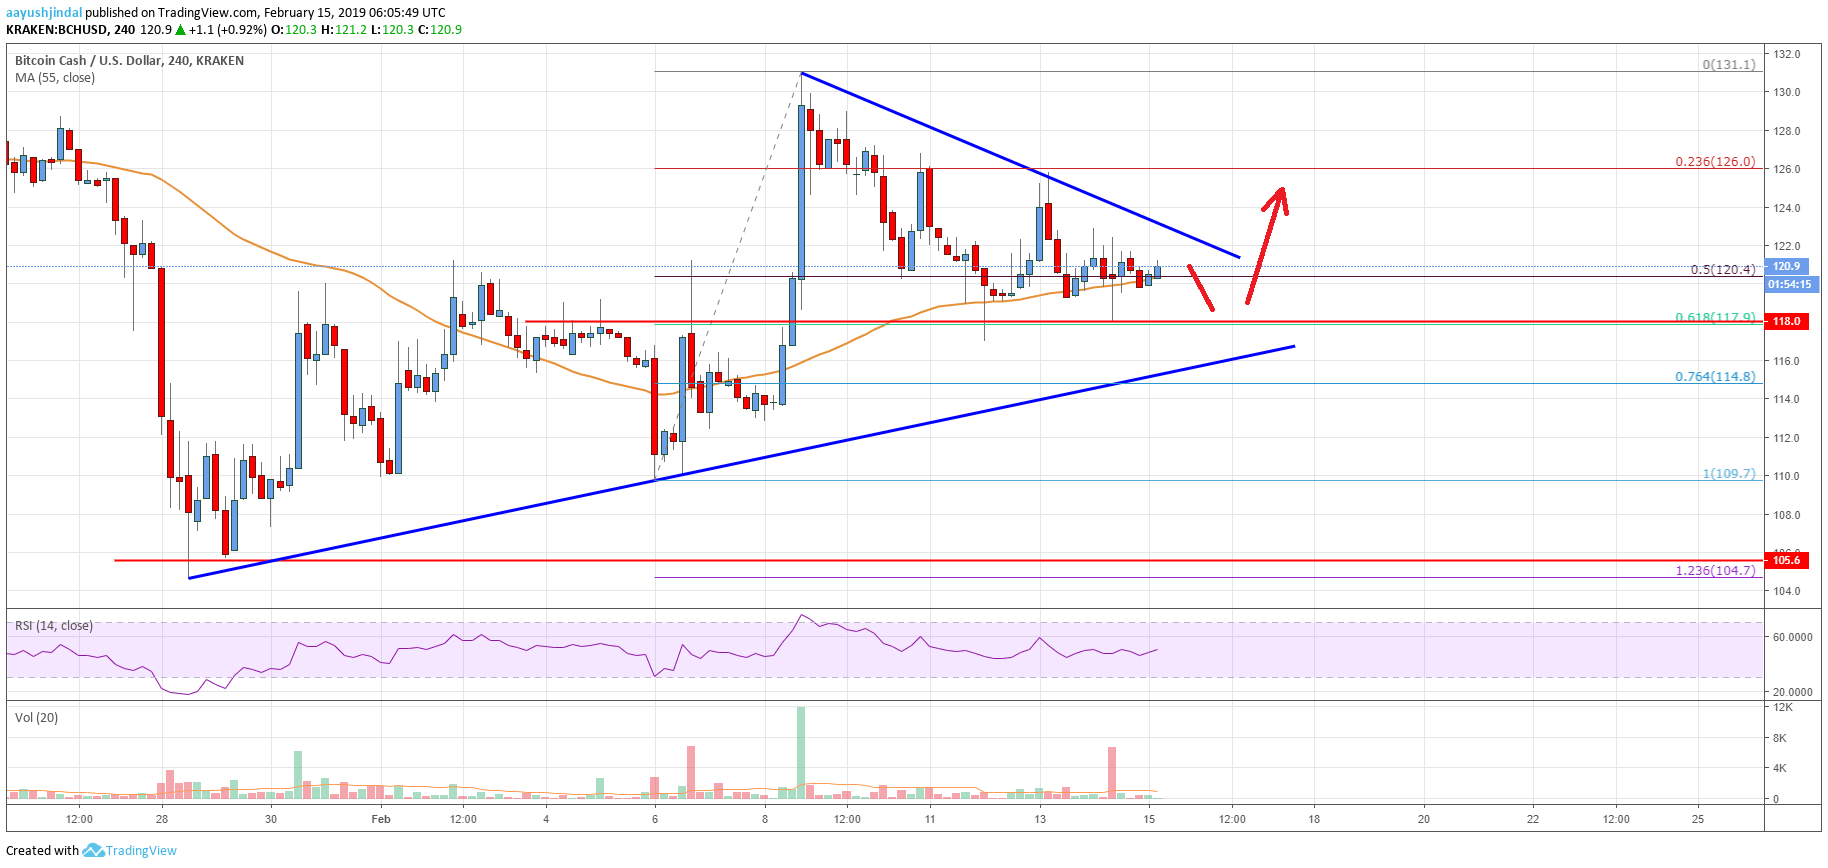
This week, there was a sharp upward move in bitcoin, ripple, Ethereum, and bitcoin cash against the US Dollar. The BCH/USD pair formed a solid support near the $105 level and climbed above many hurdles. Buyers gained momentum above the $115 and $120 resistance levels. The upward move was such that the price even broke the $125 and $130 resistance levels. Moreover, there was a close above the $120 level and the 55 simple moving average (4-hours). A new monthly high was formed near $131 and later the price started a downside correction.
There was a break below the $125 and $122 support levels. Sellers pushed the price below the 50% Fib retracement level of the last wave from the $109 low to $131 high. However, the decline was protected by the $117-118 support area. The price also managed to stay above the 55 simple moving average (4-hours). Besides, the 61.8% Fib retracement level of the last wave from the $109 low to $131 high held declines. At the outset, the price is trading in a range above the $118 support and below the $122 resistance.
It seems like there is a breakout pattern forming with resistance at $122 and $124. On the downside, there is a crucial bullish trend line formed with support at $116 on the 4-hours chart of the BCH/USD pair. If the pair breaks the trend line support, there is a risk of a downside extension below the $115 level.

Looking at the chart, bitcoin cash price seems to be holding key supports above the $117 level. However, buyers need to gain strength above the $122 and $124 levels to start a fresh rally. The next key resistances are near $130 and $135.
Technical indicators
4 hours MACD – The MACD for BCH/USD is about to move back in the bullish zone.
4 hours RSI (Relative Strength Index) – The RSI for BCH/USD is placed nicely above the 50 level, with a positive angle.
Key Support Level – $117
Key Resistance Level – $124


