- Bitcoin cash price started a downside correction after testing the $275 resistance against the US Dollar.
- The price declined below the $260 support, but it stayed above the $235-$240 support zone.
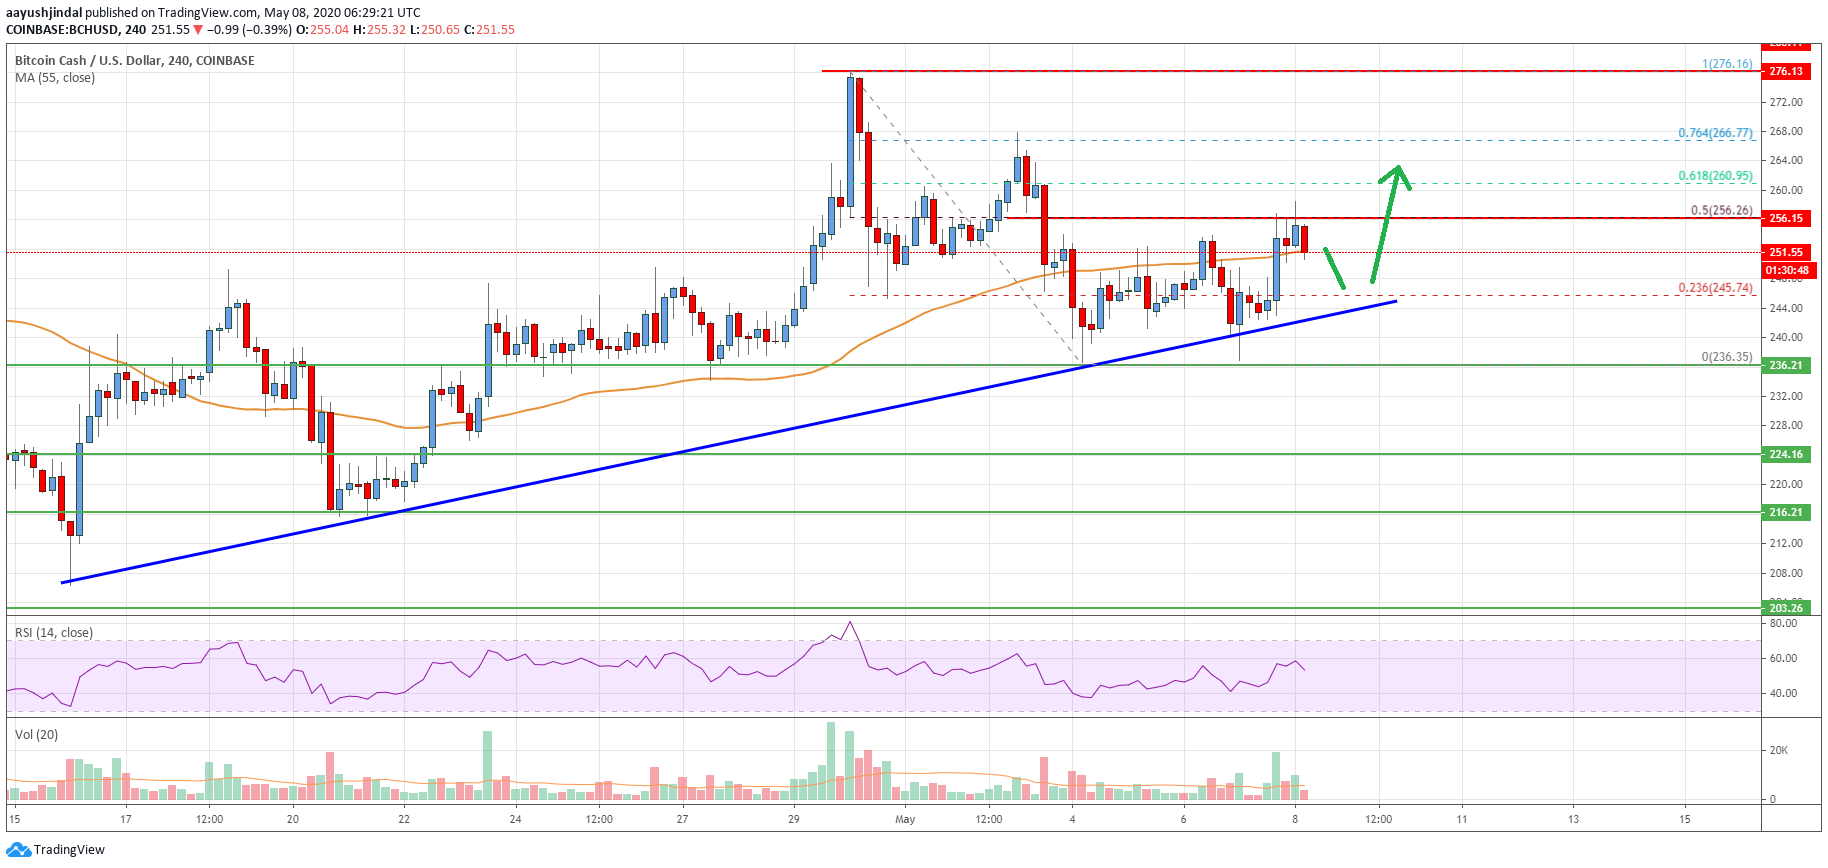
- There is a major bullish trend line forming with support near $244 on the 4-hours chart of the BCH/USD pair (data feed from Coinbase).
- The pair is likely to resume its upward move as long as it is above the $235 support.
Bitcoin cash price is trading in a positive zone above the $240 level against the US Dollar. BCH/USD must surpass the $256 resistance to climb towards $265 and $275.
Bitcoin Cash Price Analysis
This past week, bitcoin cash price gained traction and rallied above the $240 and $250 resistance levels against the US Dollar. BCH price even surpassed the $265 level and traded as high as $276 before starting a downside correction.
There was a break below the $265 level and the 55 simple moving average (4-hours). The price even broke the $250 support and traded as low as $236. It is currently rising and trading above the $245 level.
There was a break above the 23.6% Fib retracement level of the recent decline from the $276 high to $236 low. However, bitcoin cash price is currently facing hurdles near the $255 and $256 levels.
The 50% Fib retracement level of the recent decline from the $276 high to $236 low is acting as a major resistance zone. If the price breaks the $255 resistance zone, it could continue to rise. The next resistance is near the $265 level, above which the bulls are likely to aim a test of the $275 and $280 levels.
On the downside, there is a major bullish trend line forming with support near $244 on the 4-hours chart of the BCH/USD pair. The main support is now forming near the $235 level.
If the price fails to stay above the $235 support, it continue to move lower towards the $224 level. Any further losses could lead the price towards the $202 support zone.
Looking at the chart, bitcoin cash price is clearly trading above a couple of important supports above $235. Therefore, there are high chances of an upside break above the $255 and $260 levels.
Technical indicators
4 hours MACD – The MACD for BCH/USD is currently losing momentum in the bullish zone.
4 hours RSI (Relative Strength Index) – The RSI for BCH/USD is declining and approaching the 50 level.
Key Support Levels – $240 and $235.
Key Resistance Levels – $256 and $275.