- Bitcoin cash price declined after it failed to clear the $465 resistance against the US Dollar.
- The price even spiked below the $400 support and settled well below the 55 simple moving average (4-hours).
- There is a short-term rising channel forming with support near $390 on the 4-hours chart of the BCH/USD pair (data feed from Coinbase).
- The pair could recover above $420, but it might face a strong resistance near the $440 level.
Bitcoin cash price is struggling to gain momentum above $400 against the US Dollar, while bitcoin climbed 10%. BCH/USD might correct above $420 unless it dives below $390.
Bitcoin Cash Price Analysis
After struggling to clear the $465 resistance and 55 simple moving average (4-hours), bitcoin cash price started a fresh decline. BCH price formed a high near the $466 level and declined sharply below the $440 and $420 support levels.
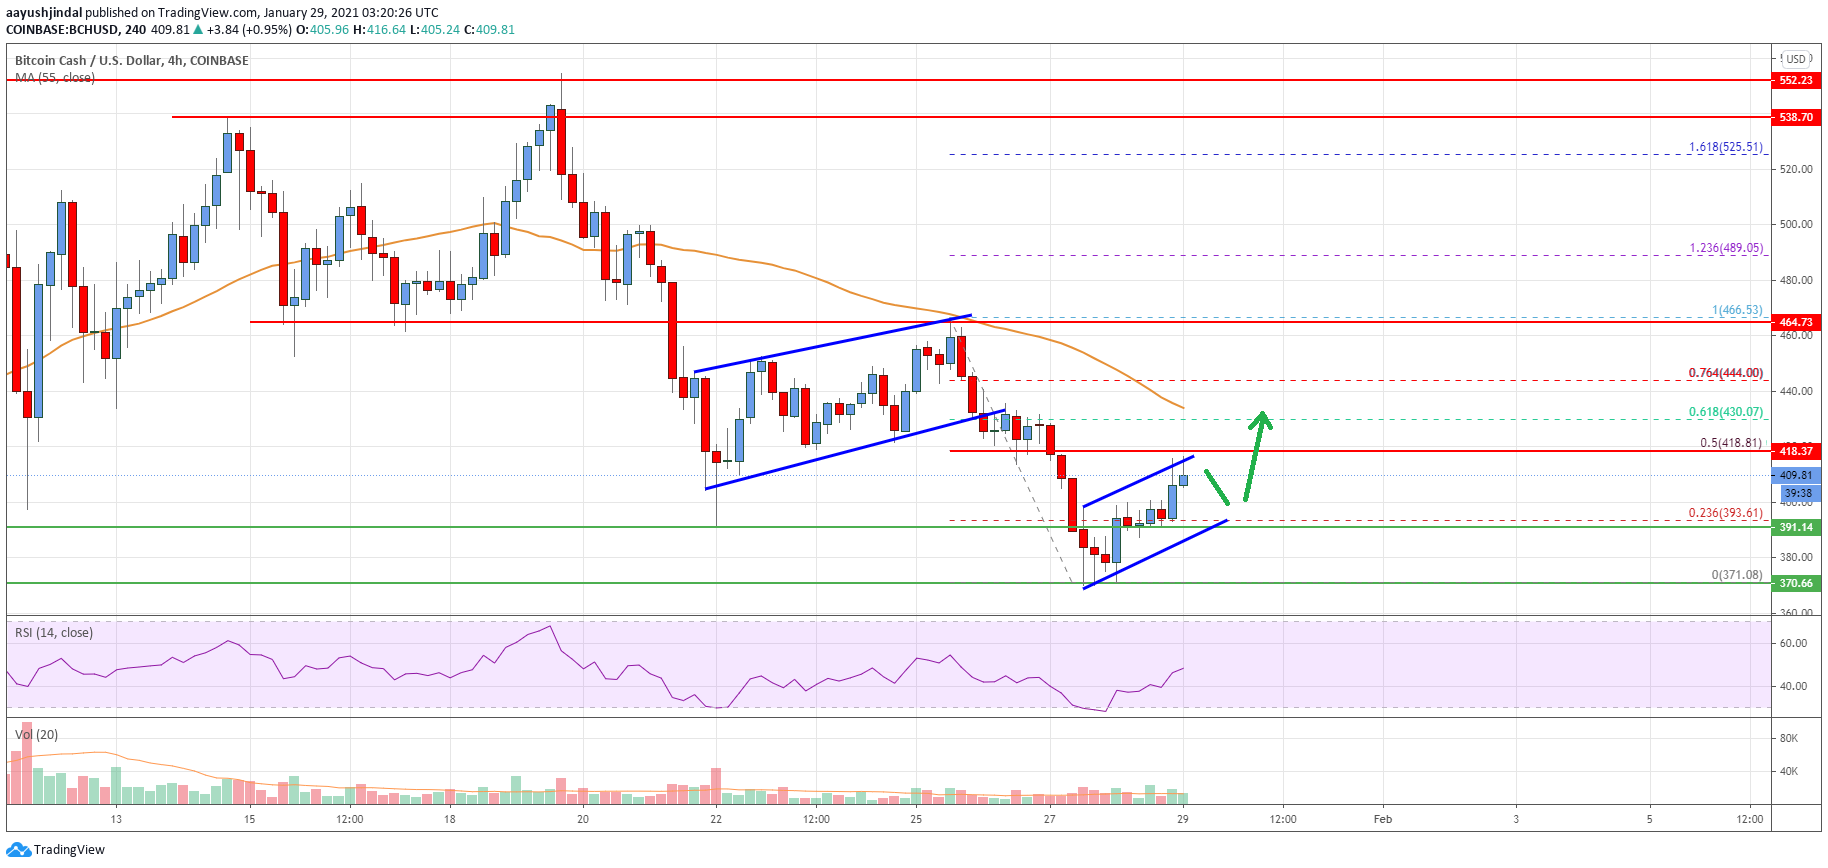
During the decline, there was a break below a rising channel with support near $430 on the 4-hours chart of the BCH/USD. The pair even spiked below $400 and settled well below the 55 simple moving average (4-hours).
A low is formed near $371 and the price is currently correcting higher. There was a break above the $385 and $390 levels. The price also recovered above the 23.6% Fib retracement level of the recent decline from the $466 high to $371 low.
It seems like there is another short-term rising channel forming with support near $390 on the same chart. If there is an upside break above the channel resistance at $418, the price could correct further higher. The 50% Fib retracement level of the recent decline from the $466 high to $371 low is also near $418.
The next major resistance is near the $440 level or the 55 simple moving average (4-hours). Conversely, the price could fail to correct above the $418-$420 zone. In the stated case, it could dive below the $390 and $385 support levels.

Looking at the chart, bitcoin cash price is clearly facing many hurdles near $420 and $440. Overall, the price could recover above $420, but it might face a strong resistance near the $440 level.
Technical indicators
4 hours MACD – The MACD for BCH/USD is slowly gaining pace in the bullish zone.
4 hours RSI (Relative Strength Index) – The RSI for BCH/USD is currently approaching the 50 level.
Key Support Levels – $390 and $370.
Key Resistance Levels – $420 and $440.


