- Bitcoin cash price currently correcting gains from the $255 resistance area against the US Dollar.
- The price is approaching a couple of key supports near $227 and $225.
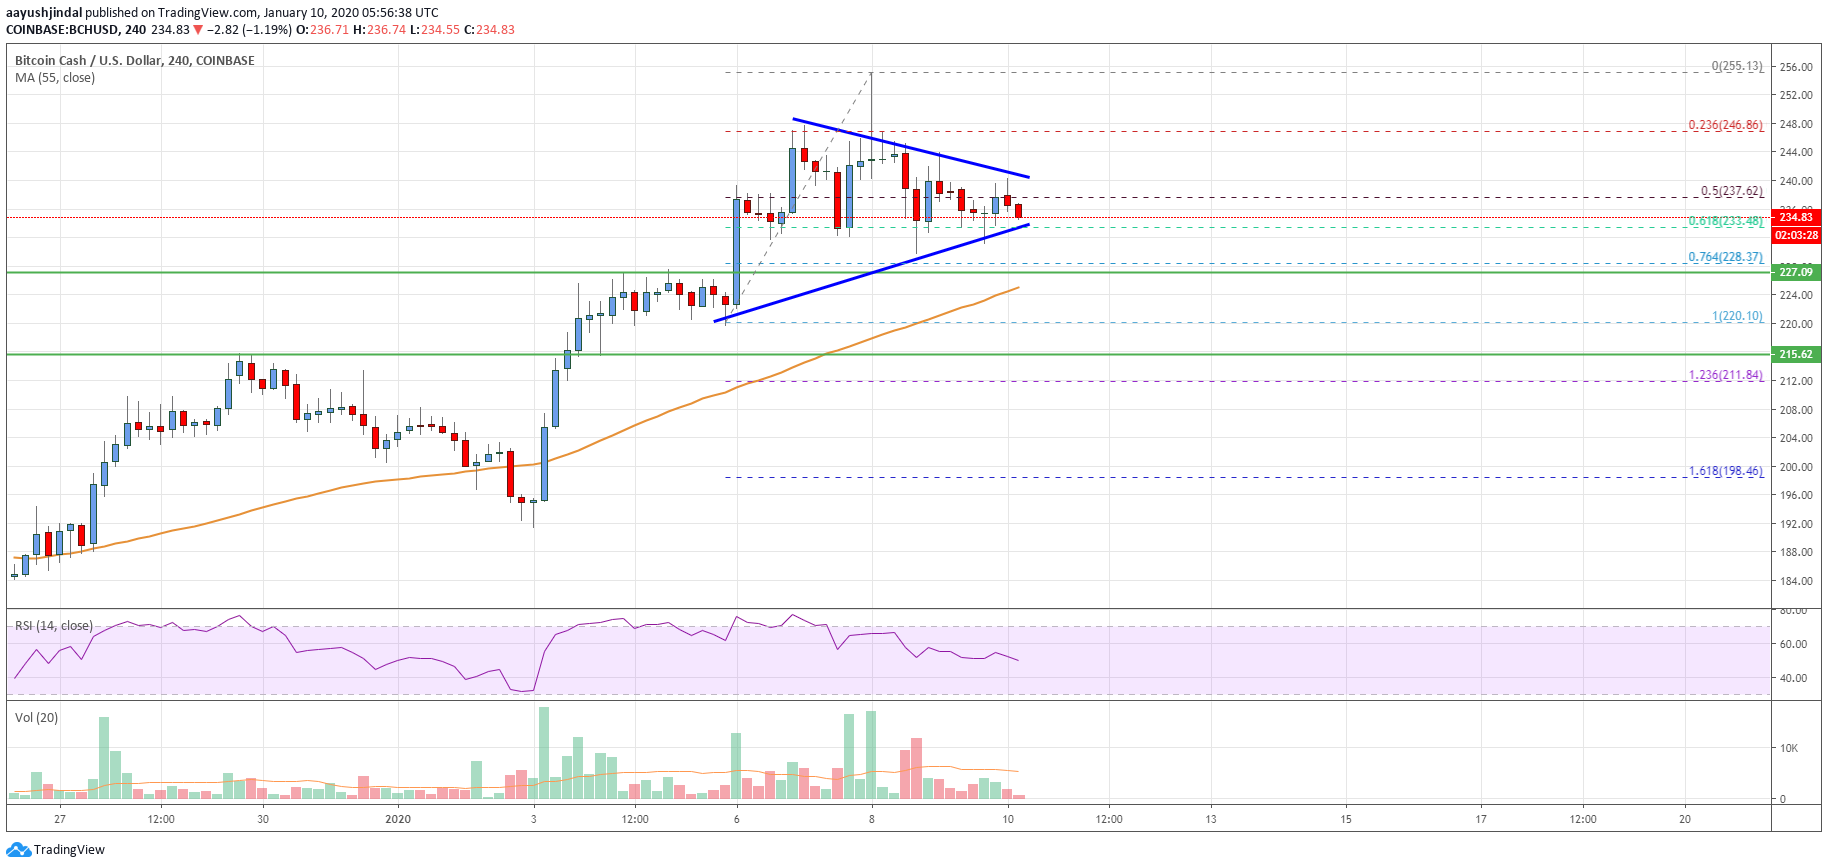
- There is a major contracting triangle forming with support near $232 on the 4-hours chart of the BCH/USD pair (data feed from Coinbase).
- The pair could dip towards the $225-$227 support area before it starts a fresh increase.
Bitcoin cash price is slowly declining losing momentum below $240 against the US Dollar. BCH/USD could bounce back as long as there is no close below $215.
Bitcoin Cash Price Analysis
This week, bitcoin cash price gained bullish momentum after it broke the $215 resistance against the US Dollar. As a result, there was a break above the $225 resistance and the 55 simple moving average (4-hours).
Finally, the price rallied above the $240 and $250 levels. A new 2020 high is formed near $255 and the price recently started a downside correction. There was a break below the $240 level.
Moreover, the price traded below the 50% Fib retracement level of the upward move from the $220 low to $255 high. At the moment, the price is finding support near the $230 level.
Besides, there is a major contracting triangle forming with support near $232 on the 4-hours chart of the BCH/USD pair. The main support on the downside is near the $227 and $225 levels. The 76.4% Fib retracement level of the upward move from the $220 low to $255 high is also near $228.
More importantly, the 55 simple moving average (4-hours) is positioned near the $225 level to provide support. Therefore, a downside break below the $227 and $225 support levels might trigger a sharp decline in bitcoin cash.
The next major support is near the $215 area (the previous breakout zone). Any further losses may perhaps call for an extended decline towards the $200 level.
Conversely, the price could bounce back from $227 or $225. On the upside, a clear break above the $240 and $245 levels is needed for a fresh rally above the $250 level.
Looking at the chart, bitcoin cash price is approaching a couple of important supports near $225. In the short term, there could be bearish spike, but the price is likely to bounce back as long as it is above $225.
Technical indicators
4 hours MACD – The MACD for BCH/USD is currently losing momentum in the bearish zone.
4 hours RSI (Relative Strength Index) – The RSI for BCH/USD is currently declining and testing the 50 level.
Key Support Levels – $225 and $216.
Key Resistance Levels – $240 and $250.