- Bitcoin cash price started a fresh surged above the $1,000 barrier against the US Dollar.
- The price is now trading well above the $1.200 support level and the 55 simple moving average (4-hours).
- There is a key rising channel forming with support near $1,360 on the 4-hours chart of the BCH/USD pair (data feed from Coinbase).
- The pair could correct lower, but dips are likely to remain well bid near the $1,200 level.
Bitcoin cash price rallied over 30% and it broke the $1,500 level against the US Dollar, while bitcoin is stuck in a range. BCH/USD is likely to remain supported near $1,200.
Bitcoin Cash Price Analysis
After breaking the $1,000 resistance zone, bitcoin cash price started a strong rally. BCH broke the $1,200 resistance zone to move further into a bullish zone.
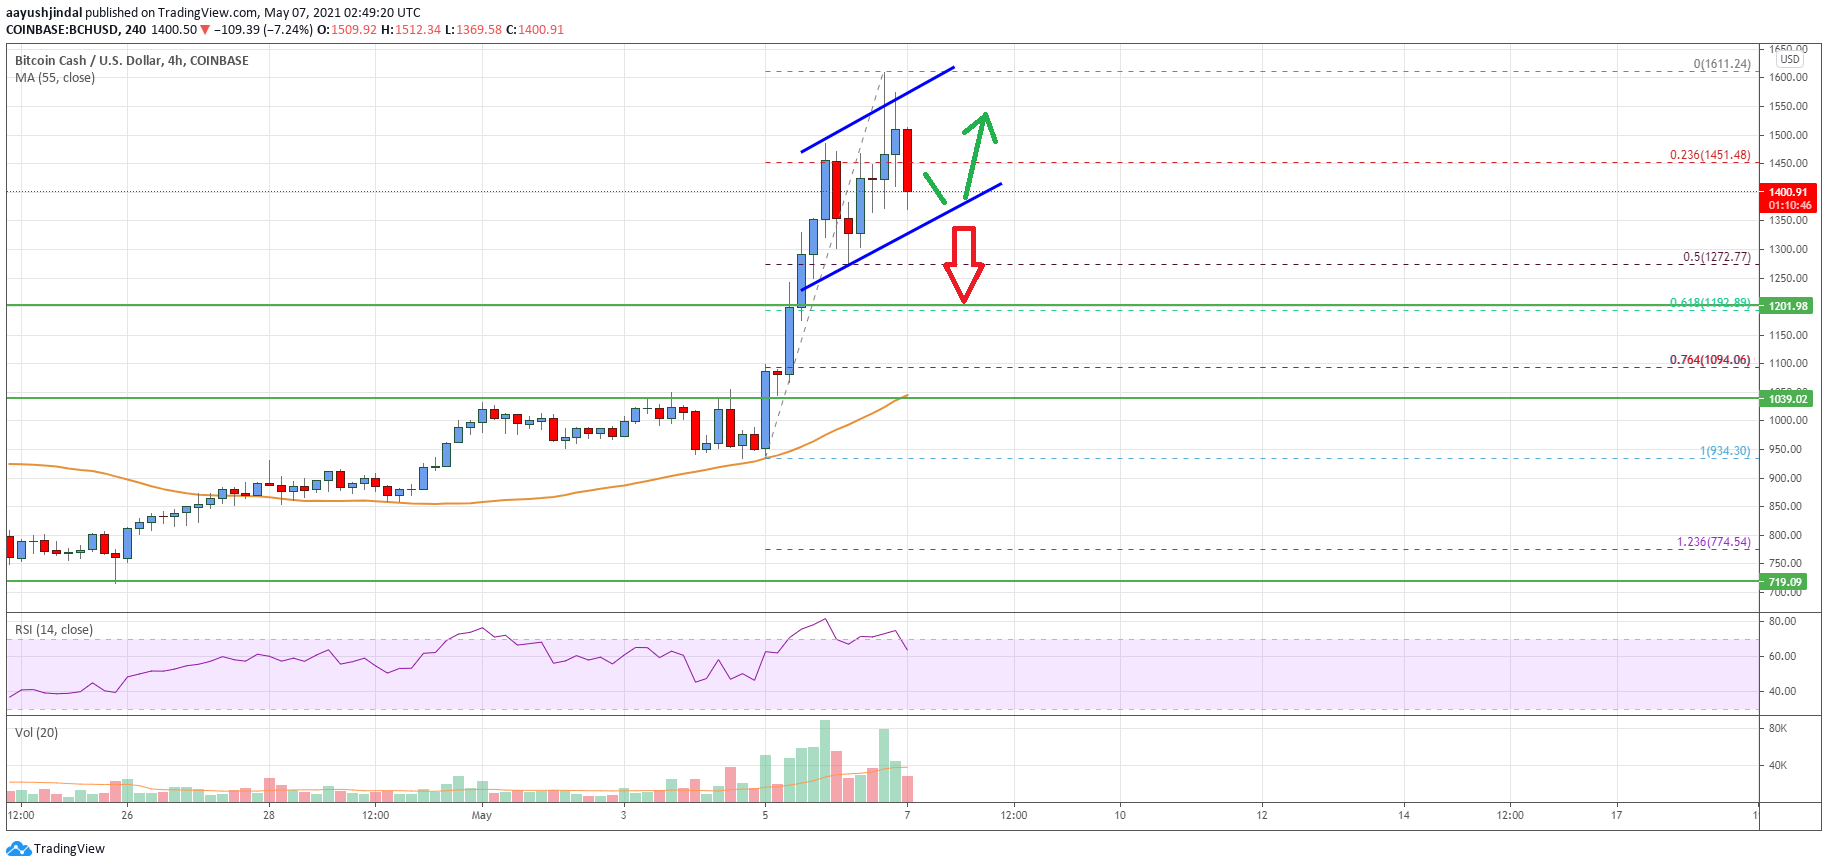
The price spiked above the $1,500 level and traded to a new yearly high at $1,611. It is now trading well above the $1.200 support level and the 55 simple moving average (4-hours). There was a downside correction recently below the $1,500 support.
The price traded below the 23.6% Fib retracement level of the recent increase from the $934 swing low to $1,611 high. On the downside, there is a decent support forming near the $1,350 level.
There is also a key rising channel forming with support near $1,360 on the 4-hours chart of the BCH/USD pair. If there is a downside break, the price could decline towards the $1,275 support. It is close to the 50% Fib retracement level of the recent increase from the $934 swing low to $1,611 high.
Any more losses could lead the price towards the main $1,200 support zone. Conversely, the price clear the $1,500 resistance once again to start a fresh increase. On the upside, the main hurdle is near the $1,600 level, above which the price could rally towards the $1,800 level.
Looking at the chart, bitcoin cash price is clearly trading well above the $1,200 level and the 55 simple moving average (4-hours). Overall, the price could correct lower, but dips are likely to remain well bid near the $1,200 level in the near term.
Technical indicators
4 hours MACD – The MACD for BCH/USD is now losing pace in the bullish zone.
4 hours RSI (Relative Strength Index) – The RSI for BCH/USD is still above the 50 level.
Key Support Levels – $1,350 and $1,200.
Key Resistance Levels – $1,500 and $1,600.