Binance appears ready for a short-term rally as it formed a double bottom reversal pattern on its 1-hour chart. Price has yet to break past the neckline around the 0.00115 level to confirm that bulls have regained control.
The 100 SMA is below the longer-term 200 SMA on this chart, though, so the path of least resistance is still to the downside. In other words, the selloff is still more likely to resume than to reverse. An upward crossover, however, could add confirmation that an uptrend is in order.
Stochastic is pointing down to indicate that sellers have the upper hand while RSI has room to head south, which suggests that Binance could follow suit. In that case, price could test the lows near 0.0009 once more.

The downtrend is clearer on the 4-hour time frame which is showing a descending channel formation. Binance is currently testing the resistance that is close to the 100 SMA dynamic inflection point.
A downward crossover just happened on this time frame, which means that there could be plenty of bearish momentum in store. A bearish divergence can also be seen as stochastic made higher highs while price had lower highs.
RSI appears to be on the move up, though, so there’s a chance that the current consolidation could turn out to be a bullish flag. A break past the channel resistance and 100 SMA could be an early signal of a reversal from the downtrend.

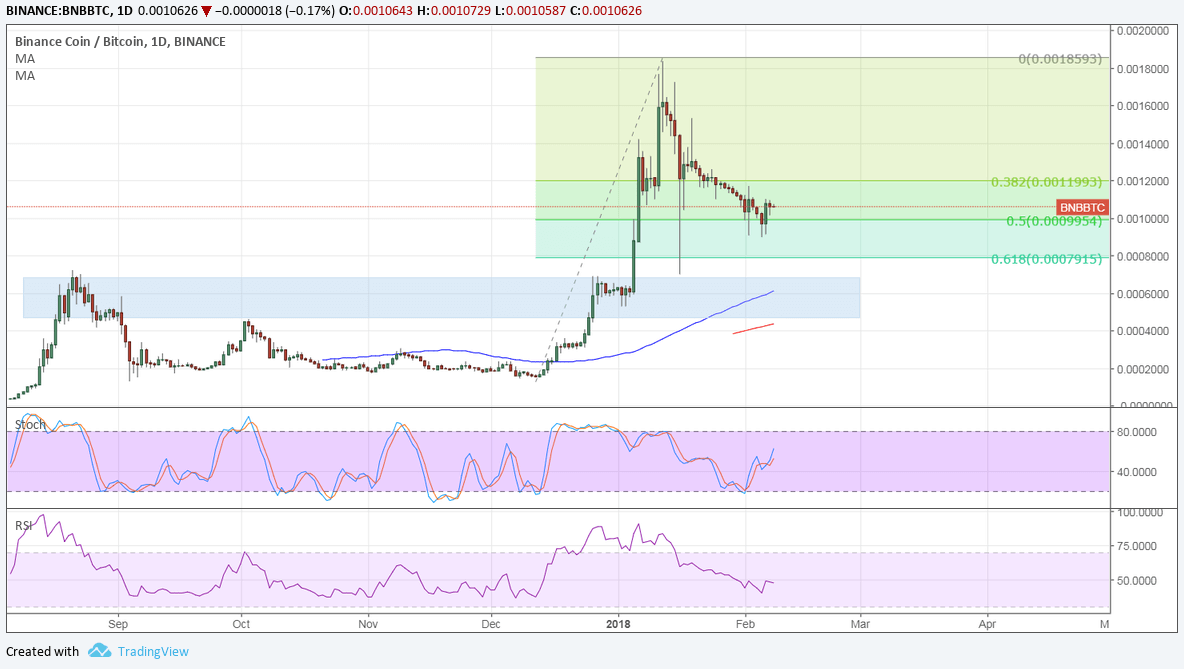
On the daily time frame, Binance still seems to be in correction mode but is already finding support at the 50% Fib. A larger correction could last until the 61.8% level around 0.0008 or the area of interest between 0.0004 to 0.0006.

This is also where the moving averages’ dynamic support levels are close by. Stochastic is already pulling up from oversold levels to show a pickup in bullish pressure while RSI appears to have bottomed out as well.


