- ADA price started a recovery wave above the $1.30 and $1.40 resistance levels against the US Dollar.
- The price is still trading below $1.50 and the 55 simple moving average (4-hours).
- There was a break above a major declining channel with resistance near $1.35 on the 4-hours chart (data feed via Bitfinex).
- The price might extend gains if it manages to clear the $1.50 resistance zone.
Cardano price is struggling below the $1.50 resistance against the US Dollar, unlike bitcoin. ADA price must clear $1.50 to continue higher.
Cardano Price Analysis
This week, cardano price saw a major decline below the $1.60 level against the US Dollar. The ADA/USD pair traded below the $1.50 support level to enter a bearish zone.
The bears gained strength for a move below the $1.35 level. The price even traded below the $1.30 level and settled below the 55 simple moving average (4-hours). A low was formed near $1.187 and the price is now correcting losses.
There was a break above the $1.35 and $1.40 levels. It even climbed above the 23.6% Fib retracement level of the downward move from the $1.75 swing high to $1.187 low.
Besides, there was a break above a major declining channel with resistance near $1.35 on the 4-hours chart. The next major resistance is near the $1.50 level. It is near the 61.8% Fib retracement level of the downward move from the $1.75 swing high to $1.187 low.
A clear break above the $1.50 resistance could pump the price towards the $1.65 level. Any more gains could push the price towards the $1.80 level.
On the downside, an immediate support is near the $1.42 level. The first major support is near $1.40. Any more losses might lead the price towards the $1.35 level, below which the bears could gain strength in the near term. In the stated case, the price could revisit $1.25.
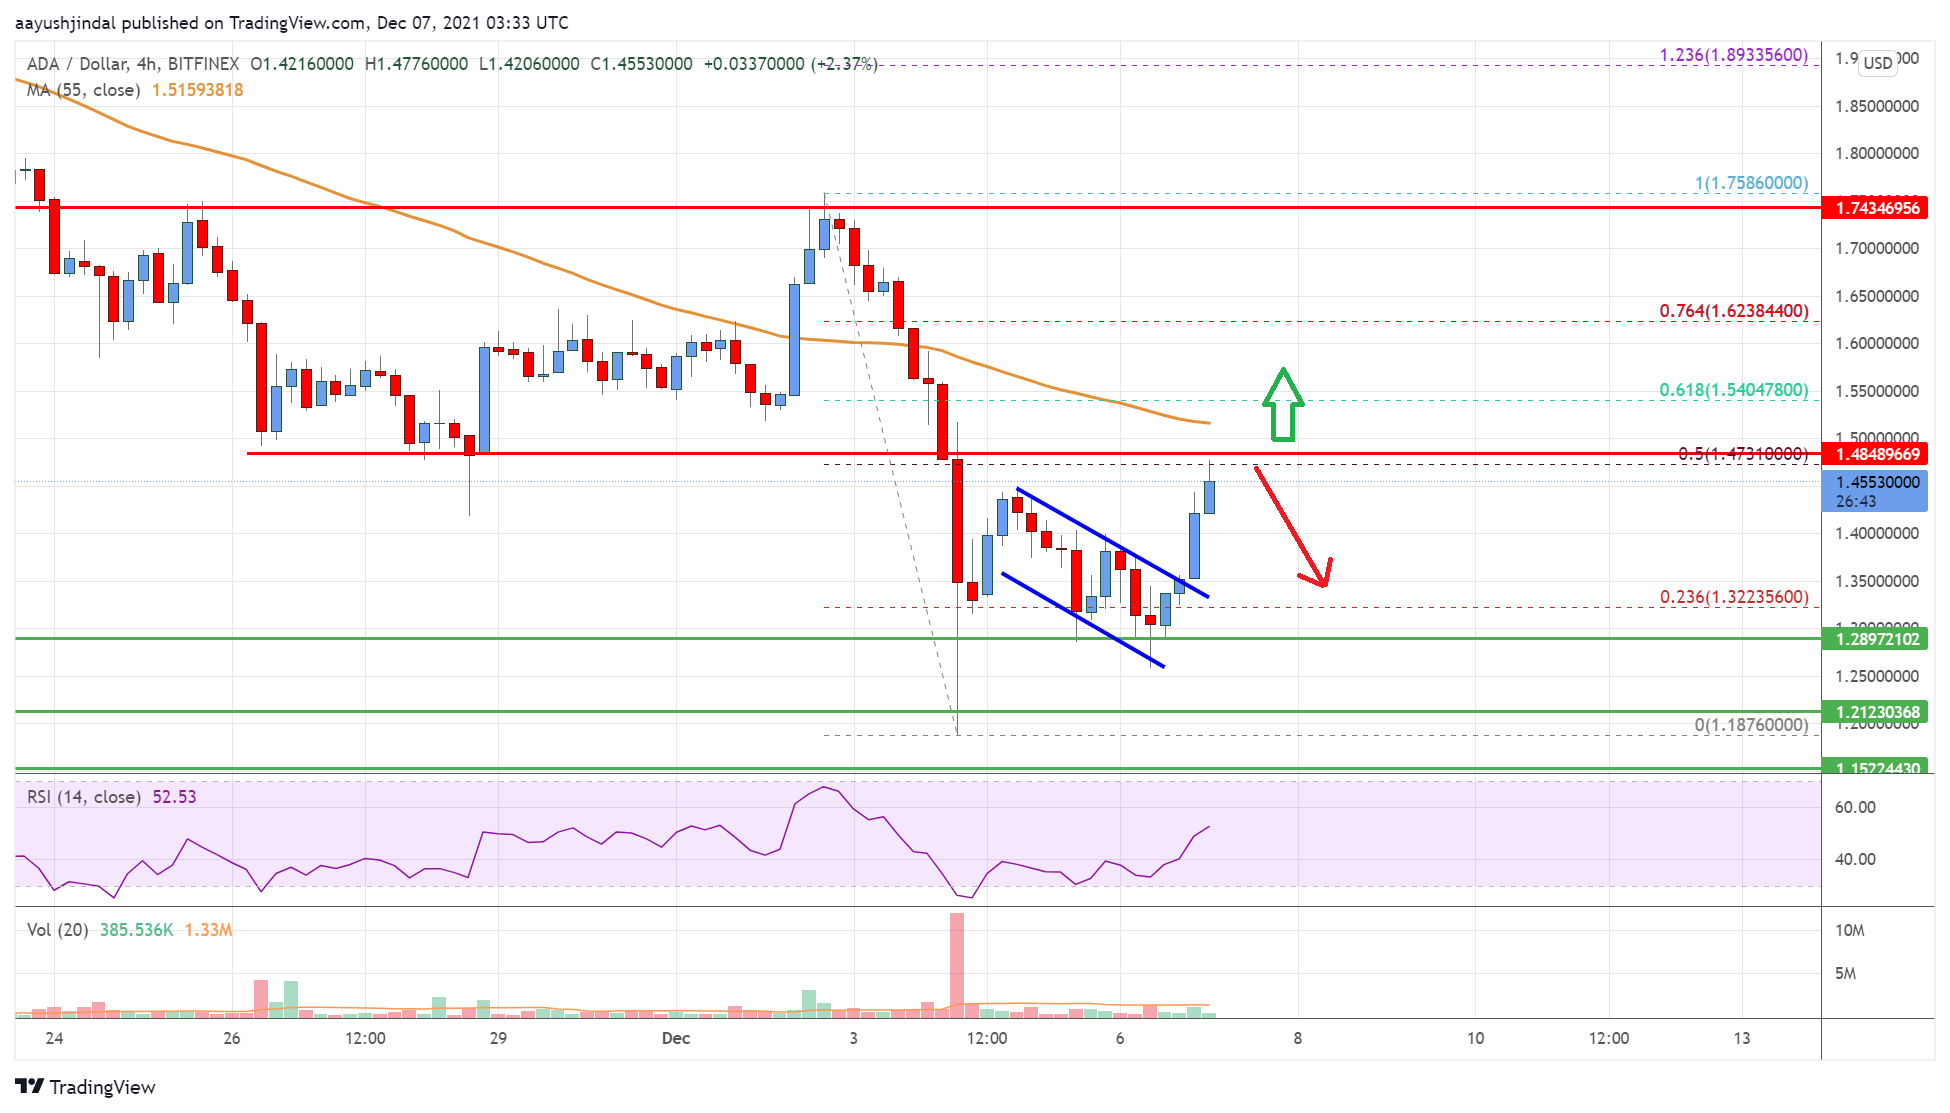
The chart indicates that ADA price is now trading below $1.50 and the 55 simple moving average (4-hours). Overall, the price might extend gains if it manages to clear the $1.50 resistance zone.
Technical Indicators
4 hours MACD – The MACD for ADA/USD is moving in the bullish zone.
4 hours RSI – The RSI for ADA/USD is now above to the 50 level.
Key Support Levels – $1.42 and $1.40.
Key Resistance Levels – $1.50 and $1.65.