- Bitcoin cash price remained supported near $720 and started a fresh increase against the US Dollar.
- The price is now trading above the $850 support level and the 55 simple moving average (4-hours).
- There was a break above a key bearish trend line with resistance near $850 on the 4-hours chart of the BCH/USD pair (data feed from Coinbase).
- The pair is likely to accelerate higher above the $900 and $920 resistance levels in the near term.
Bitcoin cash price is showing positive signs above $850 against the US Dollar, while bitcoin is sliding. BCH/USD could rally if there is a clear close above $900.
Bitcoin Cash Price Analysis
After a steady decline, bitcoin cash price tested the $720 support zone. BCH bears two attempts to clear the $720 and $700 support levels, but they failed.
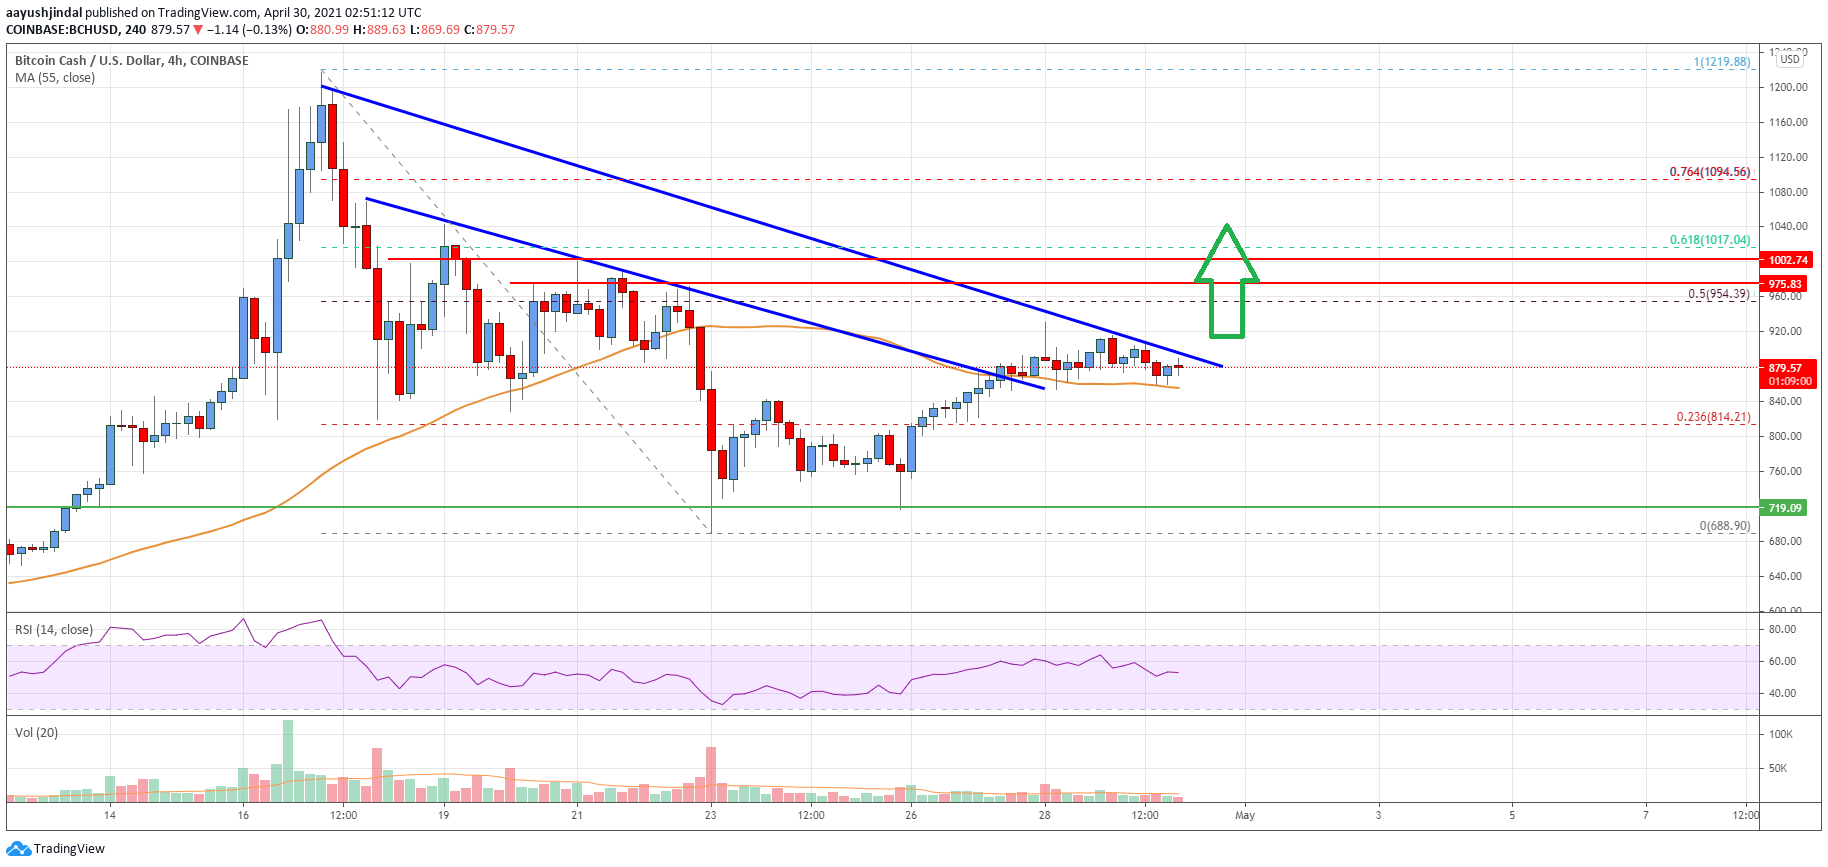
A swing low was formed near $688 before the price started a fresh increase. There was a break above the $750 and $760 resistance levels. The price surpassed the 23.6% Fib retracement level of the key decline from the $1,219 swing high to $688 swing low.
It is now trading above the $850 support level and the 55 simple moving average (4-hours). There was a break above a key bearish trend line with resistance near $850 on the 4-hours chart of the BCH/USD pair.
The pair is now facing resistance near the $900 zone. There is another major bearish trend line forming with resistance near $900 on the same chart. A clear break above $900 could spark a steady increase. The next major resistance is near the $950 level.
It is near the 50% Fib retracement level of the key decline from the $1,219 swing high to $688 swing low. The main hurdle could be $1,000. A proper close above $1,000 may possibly open the doors for a steady increase in the coming sessions.
Conversely, the price could fail to clear $900 and start a fresh decline. An initial support is near the $850 level and the 55 simple moving average (4-hours). The next major support is near the $800 level. Any more losses might call for a test of the $720 support.
Looking at the chart, bitcoin cash price is clearly trading above the $850 level and the 55 simple moving average (4-hours). Overall, the price is likely to accelerate higher above the $900 and $920 resistance levels in the near term.
Technical indicators
4 hours MACD – The MACD for BCH/USD is now gaining pace in the bullish zone.
4 hours RSI (Relative Strength Index) – The RSI for BCH/USD is above the 50 level.
Key Support Levels – $850 and $720.
Key Resistance Levels – $900 and $1,000.