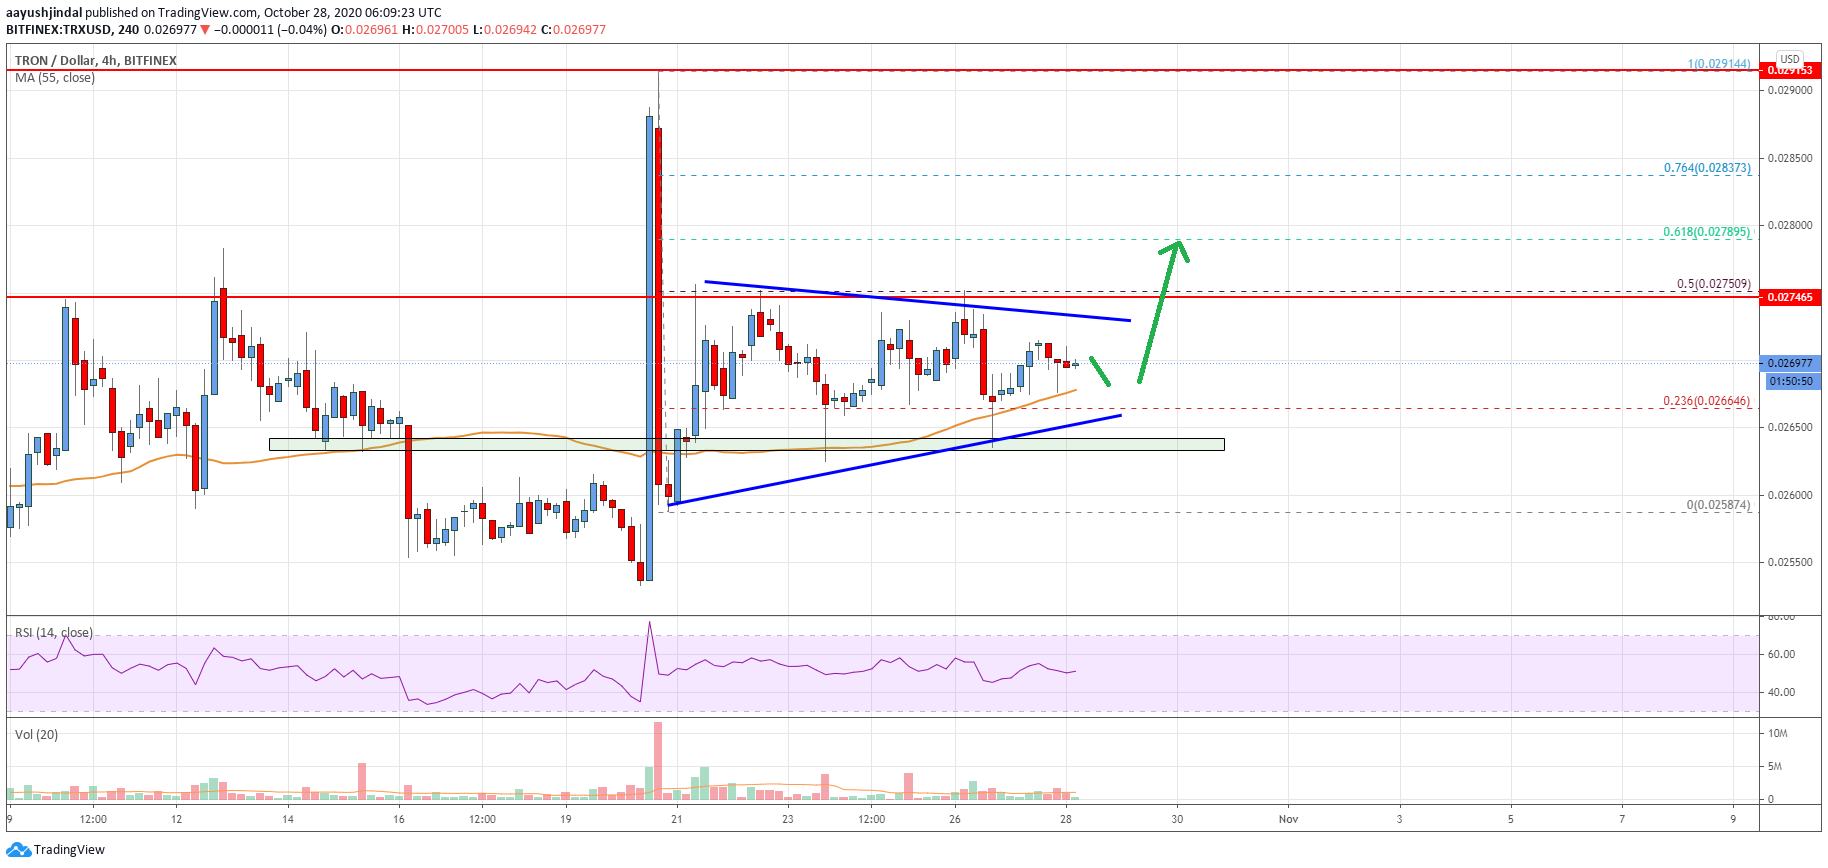
- Tron price started consolidating in a range above the $0.0265 support against the US Dollar.
- TRX price is showing positive signs above the $0.0265 level and the 55 simple moving average (4-hours).
- There is a crucial contracting triangle forming with resistance at $0.0272 on the 4-hours chart (data feed via Bitfinex).
- The pair is likely to start a fresh increase if there is a clear break above the $0.0275 resistance.
TRON price is showing positive signs above $0.0250 against the US Dollar, while bitcoin surged above $13,500. TRX price could accelerate above $0.0275 and $0.0280.
Tron Price Analysis
TRON price started trading in a range after a strong rally towards the $0.0290 zone against the US Dollar. TRX price declined below the $0.0275 support, but it remained well bid near the $0.0265 level.
A swing low is formed near $0.0258 and the price is still stuck in a range. The price broke the $0.0270 level and traded above the 23.6% Fib retracement level of the downward move from the $0.0292 swing high to $0.0258 low.
The price is now showing positive signs above the $0.0265 level and the 55 simple moving average (4-hours). On the upside, the price is facing a strong resistance near $0.0272 and $0.0275. There is also a crucial contracting triangle forming with resistance at $0.0272 on the 4-hours chart.
The 50% Fib retracement level of the downward move from the $0.0292 swing high to $0.0258 low is also near the $0.0275 level to act as a hurdle. If there is a clear break above the triangle resistance and the $0.0275 zone, the price could accelerate higher in the near term.
The next major resistance is near the $0.0280 level, above which tron price might rise steadily towards the $0.0292 and $0.0295 levels. On the downside, the 55 simple moving average (4-hours) is acting as a strong support near the $0.0268 level.
The triangle support is also near the $0.0265 level, below which there is a risk of a sharp decline. The first major support is near the $0.0255 level, below which the bulls could struggle to protect the $0.0250 support zone.

The chart indicates that TRX price clearly consolidating in a range above the $0.0265 support. However, the price is likely to start a fresh increase if there is a clear break above the $0.0275 resistance in the near term.
Technical Indicators
4 hours MACD – The MACD for TRX/USD is struggling to gain pace in the bullish zone.
4 hours RSI – The RSI for TRX/USD is just above the 50 level, with a positive angle.
Key Support Levels – $0.0265 and $0.0250.
Key Resistance Levels – $0.0272, $0.0275 and $0.0280.


