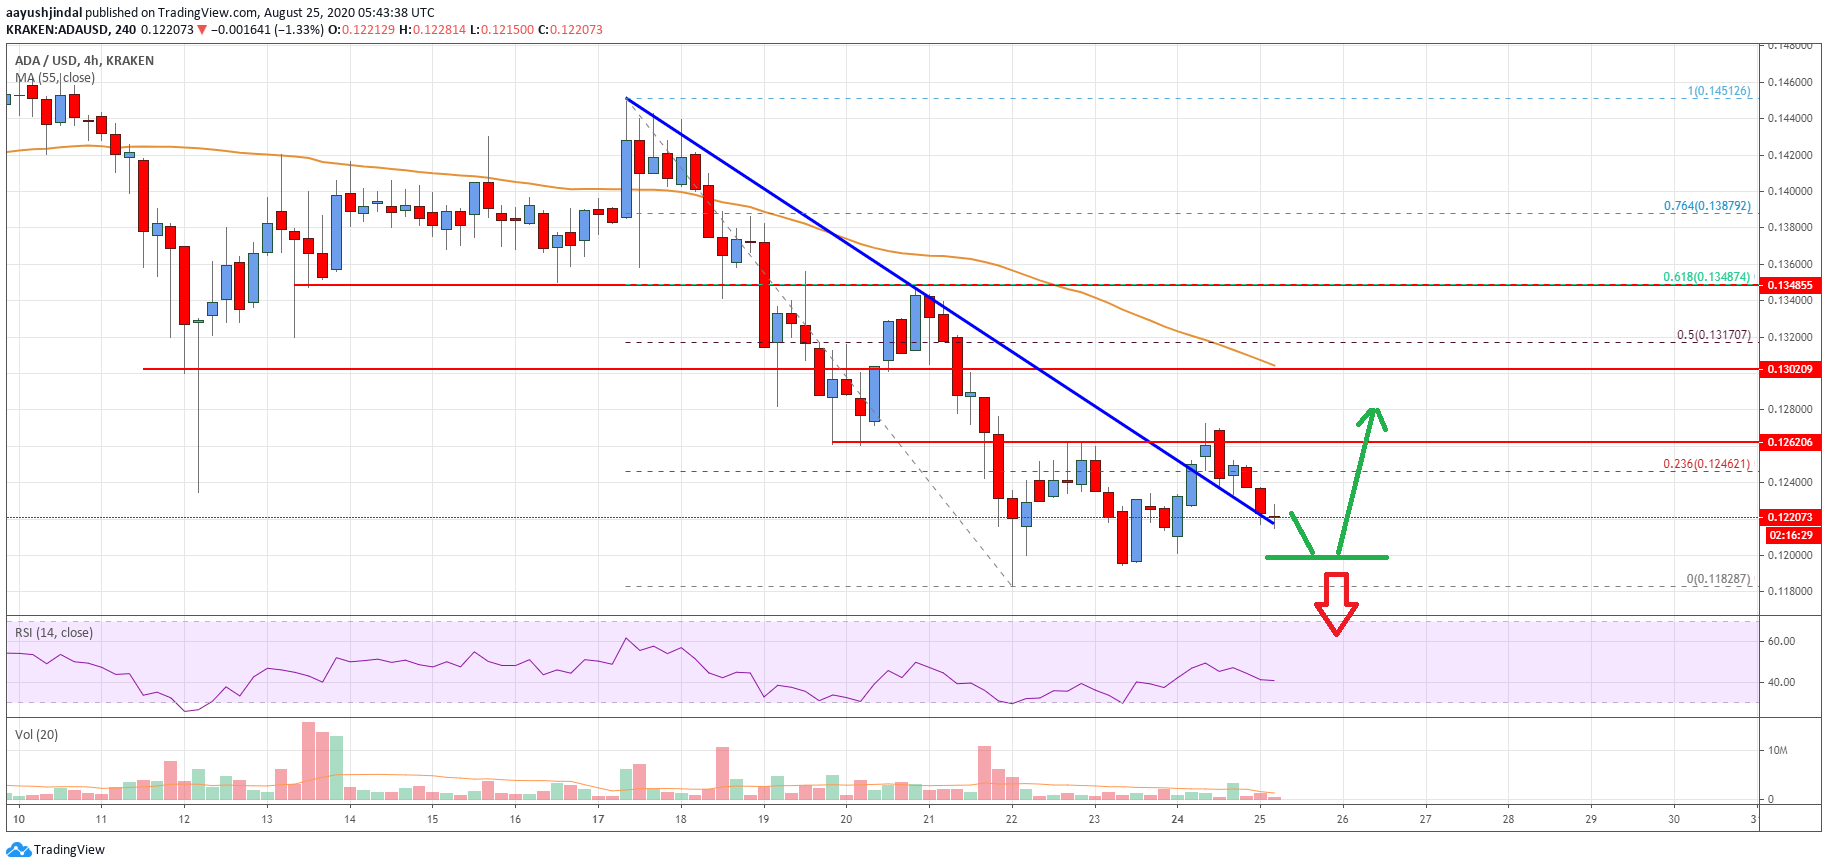
- ADA price is in a bearish zone and it is trading below the $0.1300 pivot against the US Dollar.
- The price is currently struggling to recover above $0.1250 and the 55 simple moving average (4-hours).
- There was a break above a connecting bearish trend line with resistance near $0.1245 on the 4-hours chart (data feed via Kraken).
- The price could either rally above the $0.1250 resistance or it might dive below the $0.1200 support.
Cardano price is struggling to clear $0.1250 against the US Dollar, similar to bitcoin near $12,000. ADA price could only rally above $0.1300 if it clears the $0.1250 resistance.
Cardano Price Analysis
In the past few days, there was a steady decline in cardano price below the $0.1350 support against the US Dollar. The ADA/USD pair even traded below the $0.1300 support and the 55 simple moving average (4-hours).
The price tested the $0.1200 support zone and a low is formed near $0.1182. Recently, there was an upside correction from the $0.1182 low. There was a break above the $0.1220 resistance. There was also a spike above the 23.6% Fibonacci retracement level of the downward move from the $0.1451 swing high to $0.1182 swing low.
Moreover, there was a break above a connecting bearish trend line with resistance near $0.1245 on the 4-hours chart. The price is now struggling near the $0.1250 and $0.1260 levels.
If cardano price clears the $0.1250 resistance, the next key hurdle is near the $0.1300 level and the 55 simple moving average (4-hours). The 50% Fibonacci retracement level of the downward move from the $0.1451 swing high to $0.1182 swing low is also near the $0.1310 level.
A successful close above the $0.1300 level might open the doors for a larger rally. In the mentioned case, the price could continue to rise towards the $0.1420 and $0.1450 resistance levels.
Conversely, there is a risk of a sharp breakdown below the $0.1200 and $0.1185 support levels. The next key support on the downside could be near the $0.1620 level.

The chart indicates that ADA price is clearly struggling to recover above $0.1250 and the 55 simple moving average (4-hours). Overall, the price could either rally above the $0.1250 resistance or it might dive below the $0.1200 support.
Technical Indicators
4 hours MACD – The MACD for ADA/USD is slowly gaining pace in the bearish zone.
4 hours RSI – The RSI for ADA/USD is still well below the 50 level.
Key Support Levels – $0.1200 and $0.1185.
Key Resistance Levels – $0.1250 and $0.1300.


