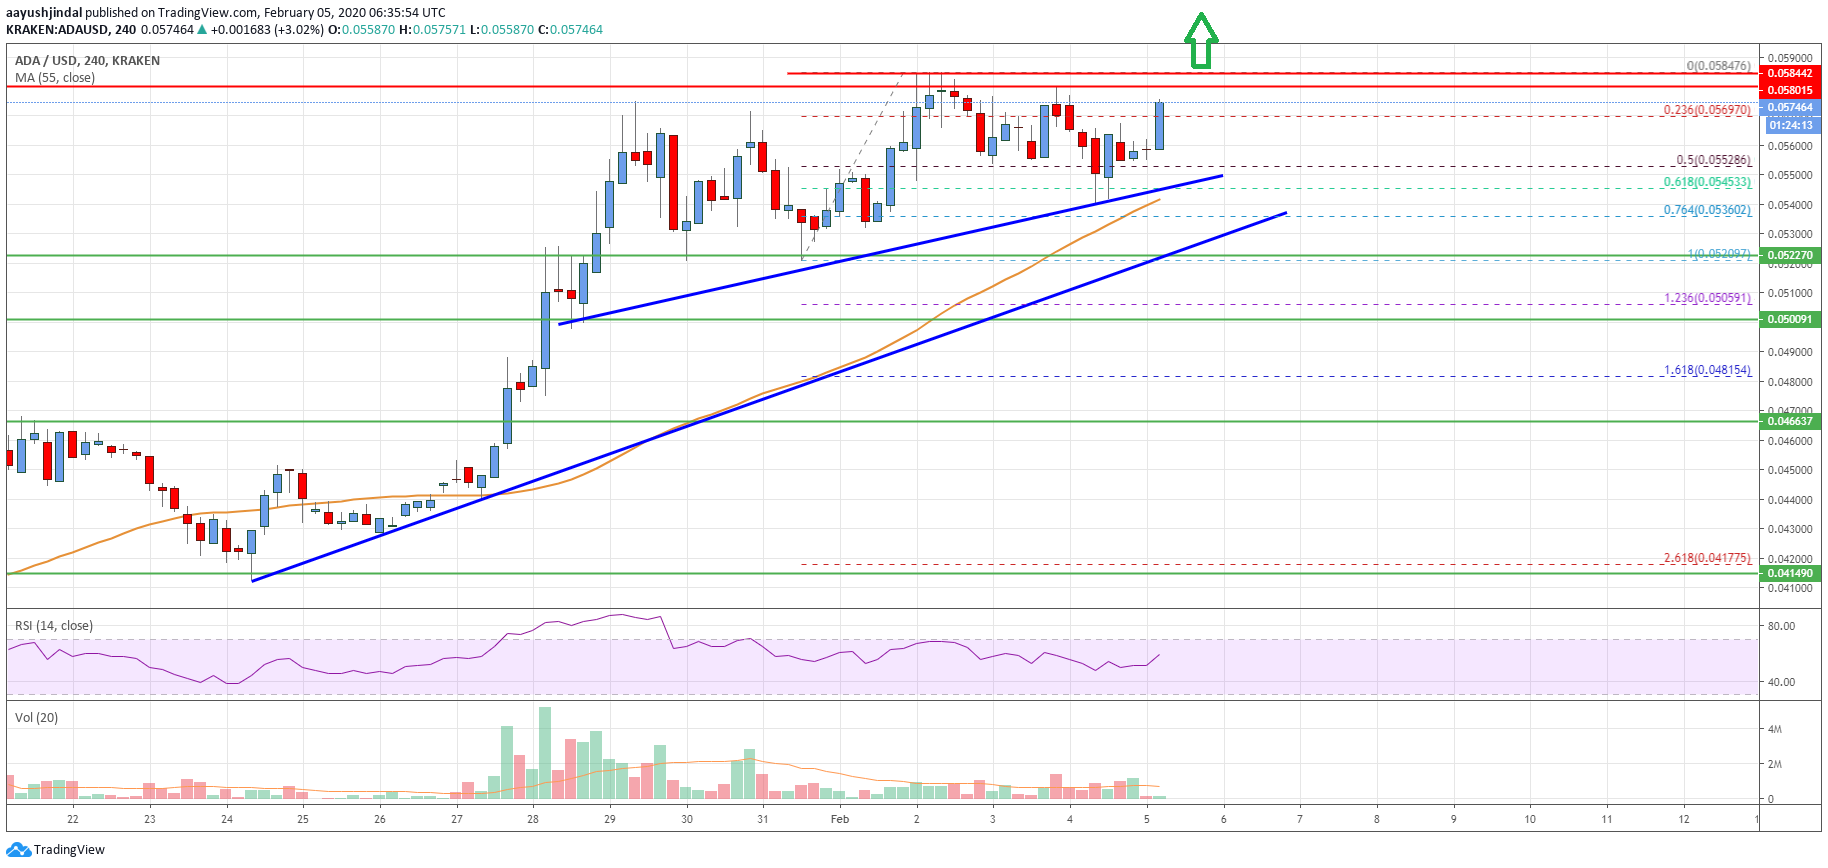
- ADA price is trading in a positive zone above the $0.0550 resistance area against the US Dollar.
- The price is likely to surpass the $0.0600 resistance area in the near term.
- There are two key bullish trend lines forming with support near $0.0550 and $0.0535 on the 4-hours chart (data feed via Kraken).
- The price remains well supported on dips towards $0.0520 if it corrects lower in the near term.
Cardano price is showing a lot of positive signs above $0.0550 against the US Dollar, similar to bitcoin. ADA price could soon clear $0.0600 for a sharp increase.
Cardano Price Analysis
In the past few days, cardano price followed a bullish path above the $0.0500 resistance area against the US Dollar. The ADA/USD pair even settled above the $0.0520 area and the 55 simple moving average (4-hours).
Finally, it broke the $0.0550 resistance and traded close to the $0.0585 level. A high is formed near $0.0584 and it is currently consolidating gains. It corrected a few points below the $0.0550 level.
Besides, there was a break below the 50% Fibonacci retracement level of the recent rise from the $0.0520 low to $0.0584 high. However, the decline was protected by the $0.0540 level.
Besides, there are two key bullish trend lines forming with support near $0.0550 and $0.0535 on the 4-hours chart. It seems like the 61.8% Fibonacci retracement level of the recent rise from the $0.0520 low to $0.0584 high acted as a strong support.
Cardano price is currently rising above the $0.0570 level. An initial hurdle is near the $0.0584 and $0.0585 levels. A clear break above the $0.0585 resistance could set the pace for more gains above the $0.0600 resistance area.
If the bulls gain pace above the $0.0600 level, the price is likely to rally towards the $0.0620 and $0.0620 levels. Any further gains will most likely call for a test of the $0.0650 level.
On the downside, there are many supports near the $0.0540 and $0.0520 levels. The main support is near $0.0520, below which there is a risk of a larger decline in the coming sessions.

The chart indicates that ADA price is trading in a solid bullish area above $0.0550 and $0.0520. Unless there is a break below $0.0520, there are high chances of a break above the $0.0600 level.
Technical Indicators
4 hours MACD – The MACD for ADA/USD is slowly gaining momentum in the bullish zone.
4 hours RSI – The RSI for ADA/USD is currently well above the 50 level.
Key Support Levels – $0.0550 and $0.0520.
Key Resistance Levels – $0.0585 and $0.0600.


