- ADA price is struggling to find strength above the $0.0370 resistance against the US Dollar.
- The price is likely to accelerate once it breaks the $0.0370 and $0.0385 resistances.
- There was a break below a major bearish trend line with resistance near $0.0362 on the 4-hours chart (data feed via Kraken).
- The price could resume its decline if it struggles to clear the $0.0370 resistance area.
Cardano price is facing an uphill task against the US Dollar and bitcoin. ADA price must clear $0.0385 to start a strong rise in the near term.
Cardano Price Analysis
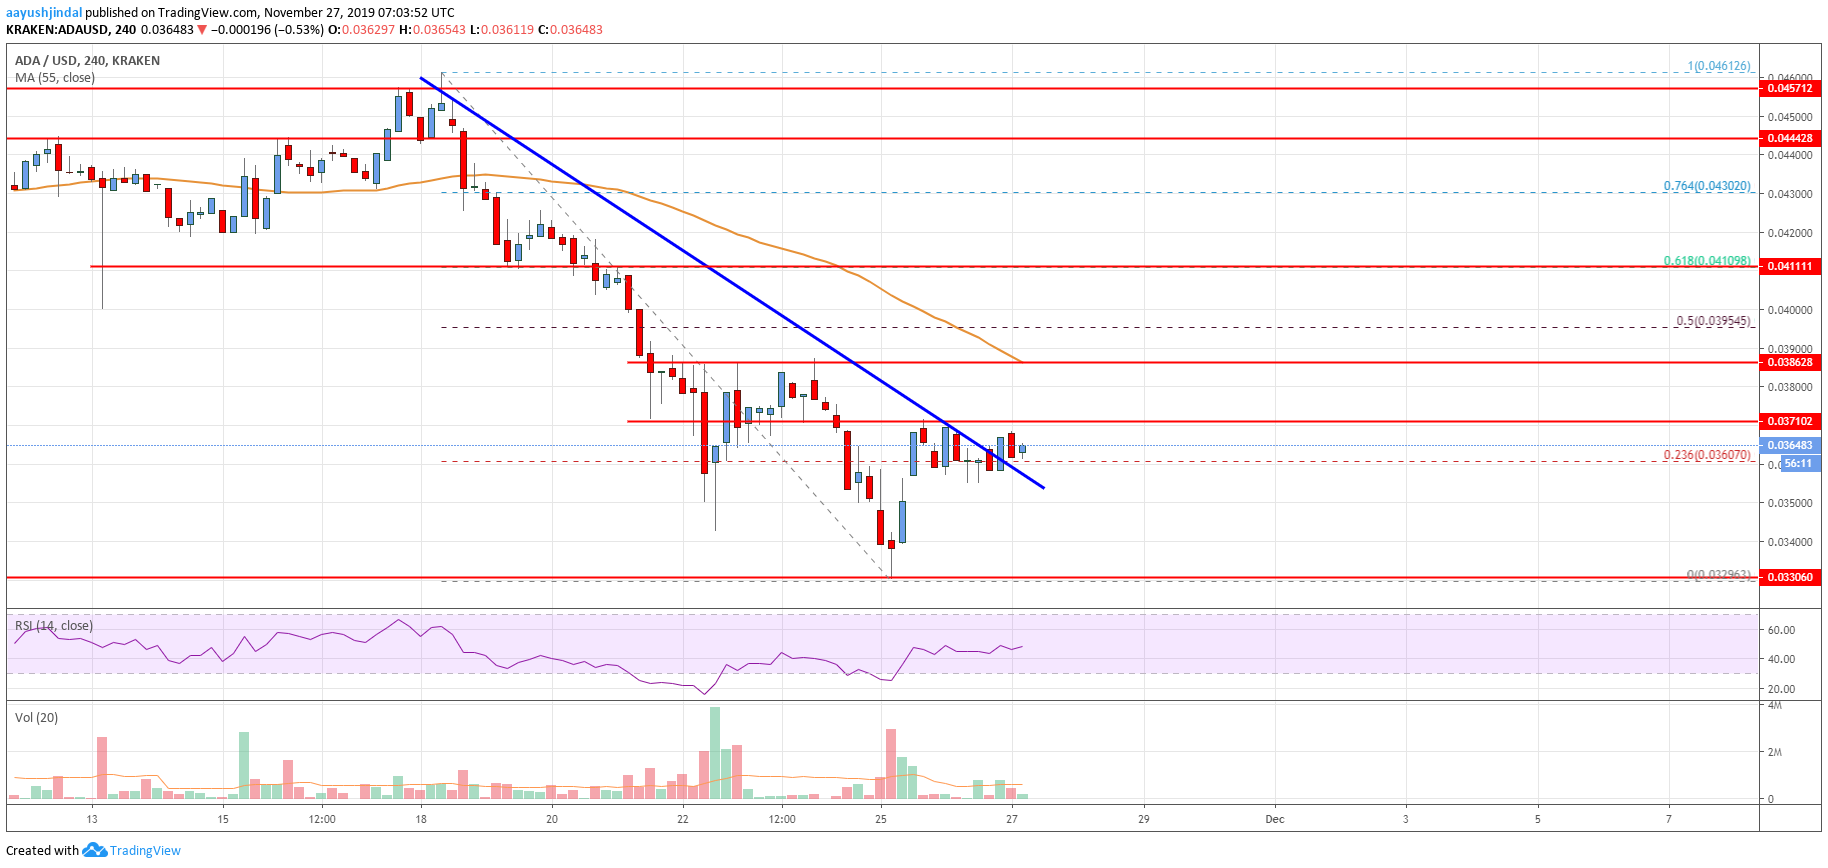
This past week, cardano price started a strong decline below the $0.0410 support area against the US Dollar. The ADA/USD pair even broke the $0.0385 support and the 55 simple moving average (4-hours).
Finally, the price traded below the $0.0350 support area. A low was formed near $0.0329 and the price is currently correcting higher. It broke the $0.0350 level, with a positive angle.
Furthermore, there was a break above the 23.6% Fibonacci retracement level of the downward move from the $0.0461 high to $0.0329 low. More importantly, there was a break below a major bearish trend line with resistance near $0.0362 on the 4-hours chart.
However, the price is facing hurdles near the $0.0370 resistance area. The next key resistance is near the $0.0385 level and the 55 simple moving average (4-hours).
The main resistance is near the $0.0395 and $0.0400 levels. The 50% Fibonacci retracement level of the downward move from the $0.0461 high to $0.0329 low is also close to the $0.0395 level.
A convincing close above the $0.0385 and $0.0395 resistance levels may perhaps open the doors for more gains in the coming sessions. The next major hurdles are near the $0.0445 and $0.0450 levels.
On the other hand, the price could fail to recover above the $0.0370 and $0.0385 resistance levels. In the mentioned case, the price is likely to resume its decline below the $0.0350 level. The main supports are near $0.0330 and $0.0320 levels.
If the price fails to stay above the $0.0320 support, there is a risk of more losses below the $0.0300 support area.
The chart indicates that ADA price is under a lot of pressure below the $0.0370 and $0.0385 resistance levels. It could either continue to rise above the $0.0385 resistance or resume its decline, plus revisit the $0.0320 support.
Technical Indicators
4 hours MACD – The MACD for ADA/USD is struggling to gain momentum in the bullish zone.
4 hours RSI – The RSI for ADA/USD is currently rising and it is likely to break the 50 level.
Key Support Levels – $0.0350 and $0.0320.
Key Resistance Levels – $0.0370 and $0.0385.