- Ethereum price is currently correcting higher after diving towards $130 against the US Dollar.
- ETH price is trading near the $150 resistance and facing a strong hurdle near $155-$158.
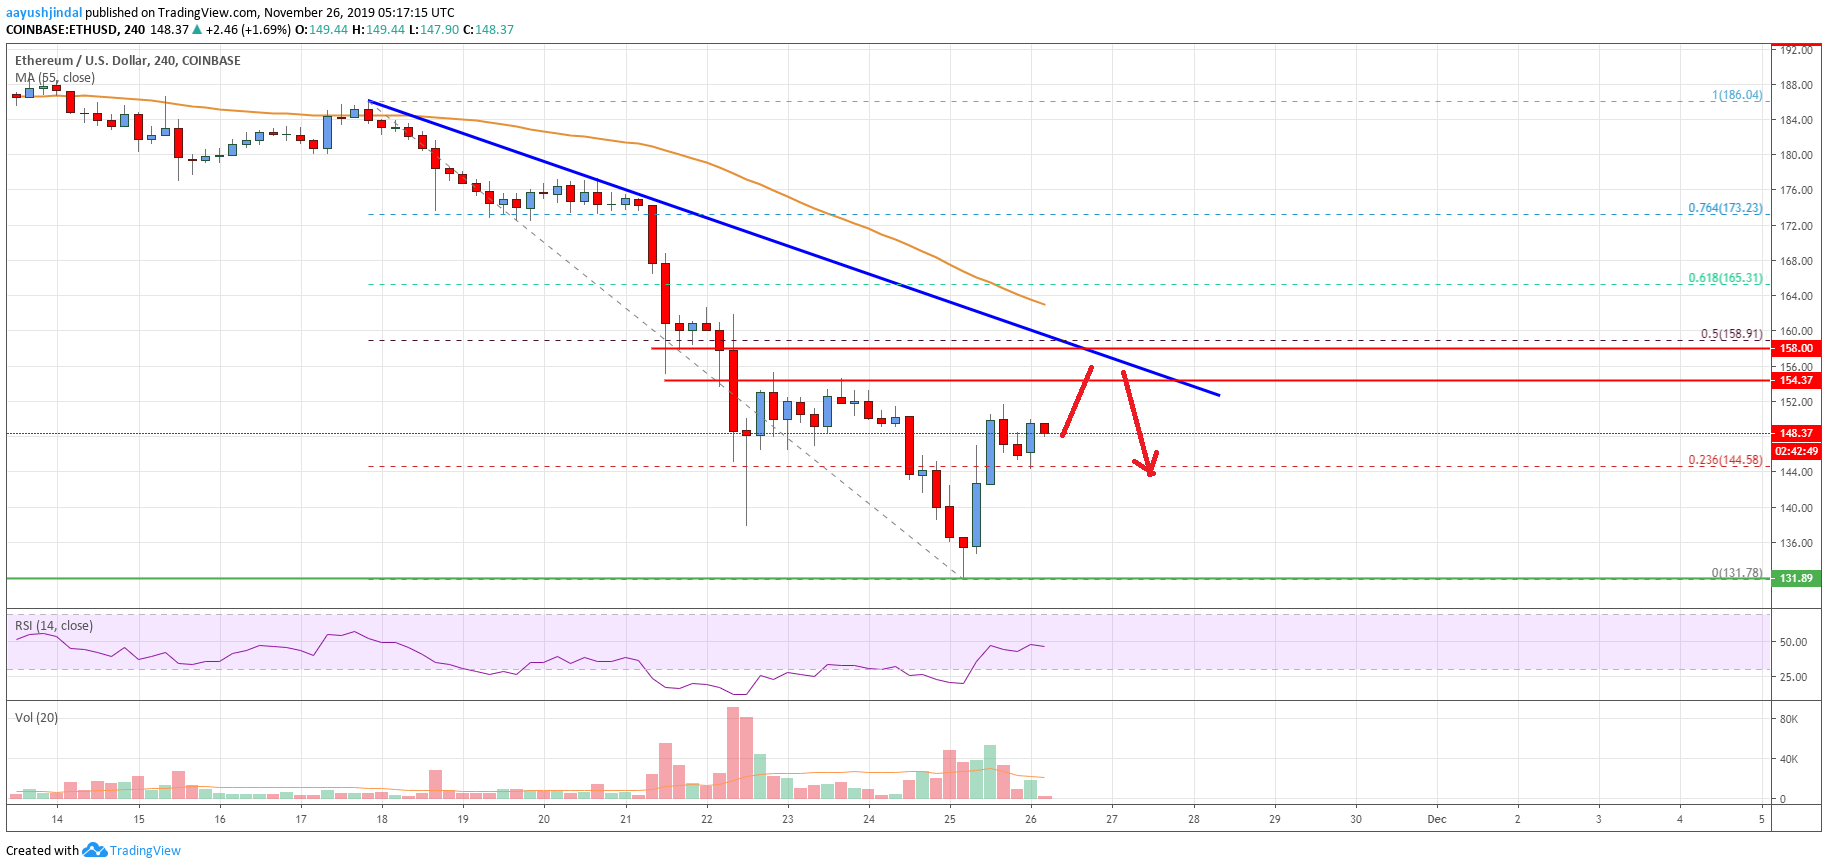
- There is a key bearish trend line forming with resistance near $158 on the 4-hours chart (data feed from Coinbase).
- The price is likely to struggle if it attempts to climb above the $158 and $160 levels.
Ethereum price is trimming recent losses against the US Dollar. Having said that, ETH price is still in a bearish zone unless it surges above the $160 resistance.
Ethereum Price Analysis
This month, there was a nasty dip in Ethereum price below the $172 and $160 support levels against the US Dollar. Moreover, ETH broke the $150 support area, the 55 simple moving average (4-hours), and traded close to the $130 area.
A new monthly low was formed near $131.78 and the price recently started an upside correction. The price recovered above the $140 resistance. Moreover, there was a break above the 23.6% Fib retracement level of the recent slide from the $186 high to $132 low.
However, the price seems to be facing a couple of key hurdles near the $150 and $152 levels. Besides, the previous supports near $155 and $158 are also crucial hurdles for the bulls.
Additionally, the 50% Fib retracement level of the recent slide from the $186 high to $132 low is near the $159 level. More importantly, there is a key bearish trend line forming with resistance near $158 on the 4-hours chart.
Finally, Ethereum could struggle to break the $160 resistance and the 55 simple moving average (4-hours). Therefore, a clear break above the $155, $158 and $160 resistance levels is must for a trend change. The next resistance is near the $174 level.
If the price fails to climb above the $155, $158 and $160 resistance levels, it could resume its decline. An initial support is near the $144 level, below which it could test the $140 support.
The main support is near the $132 zone. Any further losses may perhaps lead the price towards the $125 support area in the near term.

Looking at the chart, Ethereum price is facing an increase in selling interest below $182 and $185. Therefore, ETH bears could aim the $160 support area if the bulls continue to struggle near $182 in the near term.
Technical indicators
4 hours MACD – The MACD for ETH/USD is slowly moving into the bullish zone.
4 hours RSI (Relative Strength Index) – The RSI for ETH/USD is currently closing in towards the 50 level.
Key Support Levels – $140, followed by the $132 zone.
Key Resistance Levels – $158 and $160.


