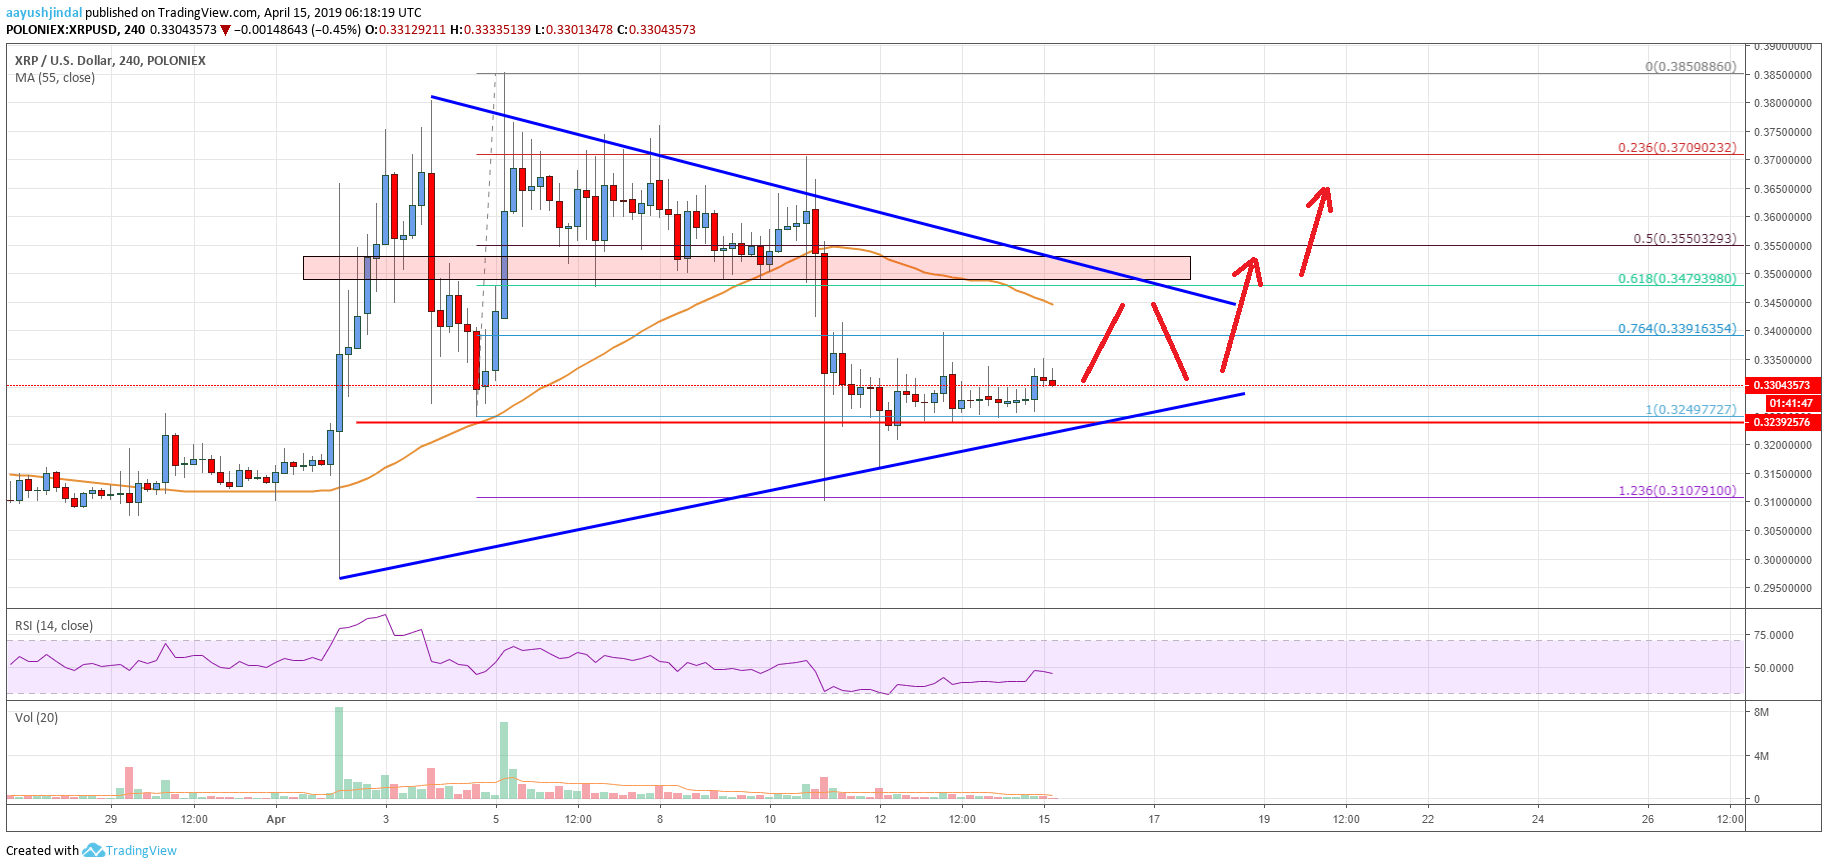
- Ripple price corrected lower and tested the key $0.3100 support area against the US dollar.
- The price recovered above the $0.3240 level and it is currently consolidating gains.
- There is a major breakout pattern in place with resistance at $0.3450 on the 4-hours chart of the XRP/USD pair (data source from Poloniex).
- The price is likely to climb higher steadily and it could even break the $0.3500 resistance area.
Ripple price is trading nicely above the $0.3240 support area against the US Dollar. XRP is showing positive signs and it might climb higher above $0.3450 and $0.3500 in the near term.
Ripple Price Analysis
This past week, we saw an extended correction in bitcoin, Ethereum, bitcoin cash, ADA and ripple against the US Dollar. Earlier, the XRP/USD pair formed a top near the $0.3800 resistance and declined sharply. There was a break below the $0.3550 and $0.3500 support levels. It pushed the price back in a bearish zone, with a break below the $0.3400 support area. The price even broke the 76.4% Fib retracement level of the last upward move from the $0.3250 swing low to $0.3850 high.
The decline was strong as the price even settled below the $0.3400 level and the 55 simple moving average (4-hours). Finally, there was a downside break below the last swing low near $0.3450. Ripple traded close to the $0.3100 support level. It tested the 1.236 Fib extension level of the last upward move from the $0.3250 swing low to $0.3850 high. Later, the price bounced back above the $0.3200 and $0.3250 levels. At the moment, the price is consolidating gains above the $0.3240 and $0.3250 levels.
More importantly, there is a major breakout pattern in place with resistance at $0.3450 on the 4-hours chart of the XRP/USD pair. On the upside, there is a strong resistance formed near the $0.3450 level and the 55 simple moving average (4-hours). A clear break above the $0.3450 level might push the price above $0.3450 resistance. The next key resistances are at $0.3550 and $0.3600.

Looking at the chart, ripple price is consolidating above the key $0.3240 support area. Besides, there is a strong support formed near $0.3250 and the triangle trend line. If buyers fail to hold the $0.3240 support, there are chances of more losses in the near term. The next main support is at $0.3200, where buyers may emerge.
Technical indicators
4 hours MACD – The MACD for XRP/USD is currently flat in the bullish zone.
4 hours RSI (Relative Strength Index) – The RSI for XRP/USD is currently just below the 50 level.
Key Support Levels – $0.3250, $0.3240 and $0.3200.
Key Resistance Levels – $0.3450 and $0.3500.


